University of Southern California
Wave Erosion Lab
Using a stream table, erosion enthusiasts examine how the density of sediment and how the slope of land contribute to the amount moved by waves. You will not be able to use this entire resource as is; there are teachers' names and...
Curated OER
Where's the Water? Stream Side Science
After a whole-class discussion of water reservoirs, ten liters of water are given to each lab group to represent Earth's total amount of water. They divide the water into smaller containers, each representing one of those reservoirs. The...
Curated OER
Eutrophication Lab
Middle schoolers examine the effects of detergents and fertilizers on aquatic life and describe algae. Students define the term eutrophication as the process by which a body of water, such as a pond, lake, stream, or river, has a sudden...
Curated OER
Measuring Rainfall and Relationships Between pH, Alkalinity and Suspended Solids in the Pago River
Eleventh graders test the pH and alkalinity of Pago River. In this ecology lesson plan, 11th graders collect data and use spreadsheet to graph results. They analyze and share their findings with the class.
Curated OER
Using Abiotic and Biotic Parameters to Monitor Air Quality
Learners identify the abiotic factors that influence a river or stream and the organisms that live in it. They measure several abiotic and biotic parameters to gauge water quality. Students examine the biotic environment by identifying...
Curated OER
Water Ecology Lab
Students determine the characteristics of a stream ecosystem and its organisms. In this water ecology lesson plan students complete several labs that shows them presence of life, water appearance, and water flow.
Curated OER
Sedimentary Rocks
Sedimentary rocks are the building blocks of this geology lesson. In it, learners discover what sedimentary rocks are and how they form. They understand the differences between the major sedimentary rock varieties and learn what types of...
Curated OER
The Stone Boat Mystery
Students design and execute a lab through which they study the distinctions between density, buoyancy, and volume.
Curated OER
Stream Chemistry Monitoring
Students become familiar with real-world gathering of chemical data. The experience how the science is done: the nature of analysis, data collection, interpretation, and presentation. They study a nearby body of water for their experiment.
Beyond Benign
Daphnia Bioassay LD50
De-icing materials may have a harmful effect on our environment; have your class perform an experiment to test the nature of these effects. Scholars monitor the survival rate of a sample of daphnia as the concentration of a de-icing...
Curated OER
Wacky Water Critters
Students visit a local creek or stream. They collect water samples from the creek and observe and sort the "water critters" they find in the sample, observing smaller organisms under a microscope if necessary. They identify each organism...
Curated OER
Salinity in Mill Creek
Fifth graders use water samples collected at three different locations of Utah's Mill Creek to test salinity of water, hypothesize about salinity levels at each location, record results, and discuss their findings with classmates. ...
Curated OER
New Jersey Estuaries
Students observe a stream table activity to realize how an estuary protects the mainland from floodwaters. They predict what will happen, then draw and write up the results.
What happened to the frogs?
Students will select ten rubber frogs and determine their pollutant source based on their malformations. Students will write a brief essay on their findings. Students will be engaged in the lesson the entire time!
Curated OER
Dissolved Oxygen Activity
Students explore why dissolved oxygen must be present for aquatic life to survive. They explain what dissolved means. Students discuss what dissolved oxygen is. They watch as the teacher lights two candles and place a jar over one of...
Curated OER
Hawaii's Freshwater Ecosystems
Learners examine brackish water. In this Science lesson plan, students observe organisms found in brackish water. Learners record their observations of the various organisms.
Curated OER
Understanding Salinity
Middle schoolers discuss why the ocean is salty. They discuss what salinity is. Students are told that is they want to know how much salt is in a body or water, they would use a special scientific tool. They complete an Estuarine Layers...
Curated OER
Is Your Water Clean?
Students compare water quality of different sources. They test water samples for odor, phosphates, pH, bacteria, and dissolved solids. they fill out a data table and answer questions about their findings.
Curated OER
Water Quality
Students use a microcomputer connected to a conductivity probe to measure the total dissolved solids in local area water samples. Students then compare their measurements with others in their class as well as other standard measurements.
Curated OER
New York City Water Quality Assessment Project
Young scholars investigate the chemistry of water and how its molecular structure supports life through its biochemcial, physical, and environmental roles. They investigate the quality of water as it interacts with the environment. ...
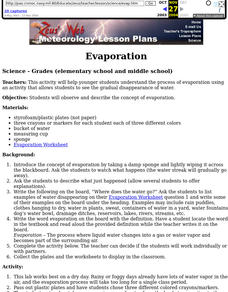
Curated OER
Evaporation
Students explain the process of evaporation using an activity that allows students to see the gradual disappearance of water.
Curated OER
On the Trail with Lewis and Clark
Eighth graders use the Internet to conduct research on the Lewis and Clark journals and work cooperatively in planning and delivering a presentation.
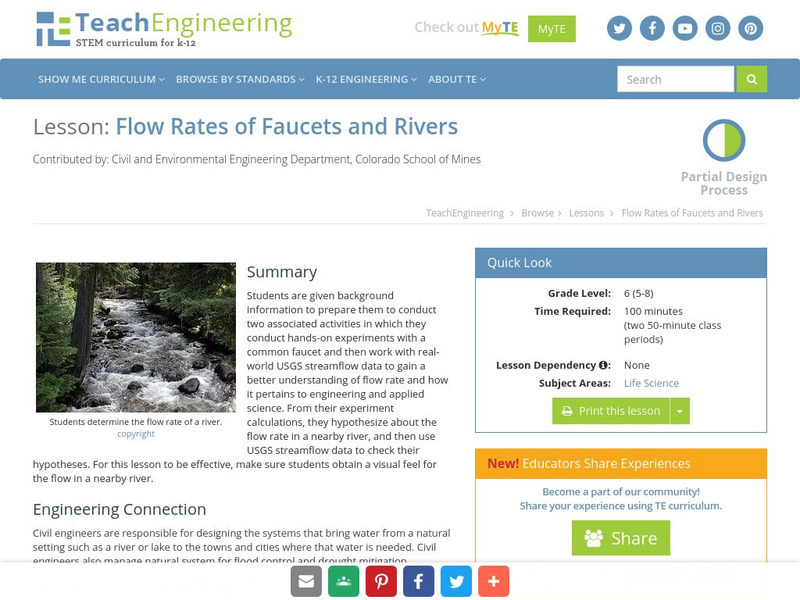
TeachEngineering
Teach Engineering: Flow Rates of Faucets and Rivers
In the Flow Rate Experiment, students perform hands-on experiments with a common faucet, as well as work with the Engineering Our Water Living Lab (accessible through TeachEngineering.com) to gain a better understanding of flow rate and...
Science Education Resource Center at Carleton College
Serc: Flow Characteristics of the Crow River
Students make observations of a local river, and then formulate a question. Then, through guided inquiry, construct, conduct, and collect data on a question they wish to research. Students keep a field journal of their observations,...


