Curated OER
The Environment and Interactions of Living Organisms
Young scholars study the environment and interactions of living organisms. They identify abiotic and biotic factors and create a foldable and vocabulary cards. They create a poster illustrating soil and watch a video to study symbiosis.
Curated OER
Understanding Equations of Functions
Students write equations for different functions. In this algebra lesson, students observe data and find the function that goes along with that data. The identify the line of best fit.
Curated OER
Color Me Hot
Seventh graders use the scientific method, to observe, record and analyze the data they gathered. They make observations using their five senses. Students compare, contrast and draw conclusions based on the observations and data...
Curated OER
Modeling With Quadratics
Students investigate quadratics through word problems. In this algebra lesson, students models the number of registered males in apprenticeship programs. They investigate the transformation of quadratic function on a coordinate plane.
Curated OER
Modelling Periodic Phenomena
In this Pre-calculus/Trigonometry worksheet, students determine the trigonometric function that best models the given data. The eight page worksheet contains explanation, examples, and twenty-one problems. Answers are not included.
Curated OER
The Hot Dog Stand - An Annual Report
Students run a computer simulation and collect data as they work and use the data to create an annual report for their business. It is desirable for students to do this project individually, but it could be done as a class using a large...
Curated OER
TV Viewing
Students test a hypothesis to see if there is a direct correlation between number of hours of TV viewing and academic grade. They collect and compile data to enter on a spreadsheet and create a word processing document supporting their...
Curated OER
What Can Scatterplots Tell Us?
Eighth graders use data from surveys conducted with parents, peers and themselves to create computer-generated scatterplots. They make inferences from their scatterplots.
Curated OER
Fitting a Line to Data
Students work together in groups to collect data in relationship to how much water marbles can displace. After the experiment, they use the data to identify the linear equation to determine the best-fit line. They use the equation to...
Curated OER
Definition and Applications of Computational Science
Students participate in a variety of instructional experiences about Computer Science. They define Computational Science and describe computational simulation. They also compare and contrast Computational Science and Computer Science.
Curated OER
A Statistical Look at Jewish History
Learners complete their examination over the Jewish Diaspora. Using population figures, they discover the importance of percentages in exploring trends. They use their own ethnic group and determine how it is represented in the United...
Curated OER
Investigating the Soil
Students explore the Earth's crust by researching pH levels and acidity. In this environmental safety lesson, students identify the pros and cons of acidity within soil and how it affects plants. Students collaborate in a pH level...
Oswego City School District
Regents Exam Prep Center: Scatter Plots and Line of Best Fit
Use this lesson, practice exercise, and teacher resource in planning instruction on scatter plots and line of best fit. In the lessons, you'll find definitions and examples of ways to make a scatter plot, determine correlations, and find...
Houghton Mifflin Harcourt
Holt, Rinehart and Winston: Homework Help Independent Practice: Scatter Plots
Get independent practice working with scatter plots. Each incorrect response gets a text box explanation and another try. Correct responses are confirmed.
Cuemath
Cuemath: Scatter Plot
A comprehensive guide for learning all about scatter plots with definitions, how to construct and solve them, types of scatter plots, solved examples, and practice questions.
Other
Nearpod: Construct & Interpret Scatter Plots
In this lesson plan on scatter plots, 8th graders will learn how to interpret scatter plots and then graph them using a data table.
Khan Academy
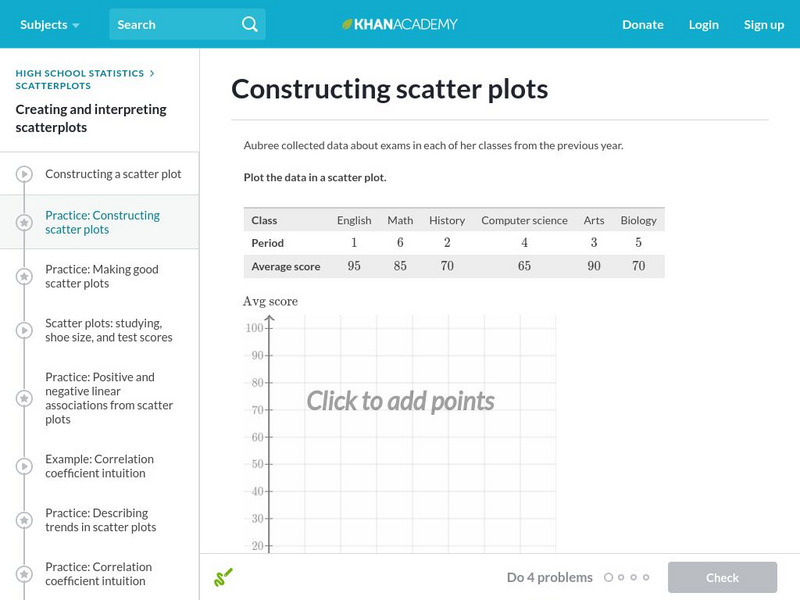
Khan Academy: Constructing Scatter Plots
Practice plotting points to construct a scatter plot. Students receive immediate feedback and have the opportunity to try questions repeatedly, watch a video, or receive hints.
Quia
Ixl Learning: Scatter Plots
Brush up on your math skills relating to scatter plots then try some practice problems to test your understanding.
Texas Instruments
Texas Instruments: Mc Dougal Littell Algebra 1: Graphing a Scatter Plot
Students will make a scatter plot and explore any patterns.
Khan Academy
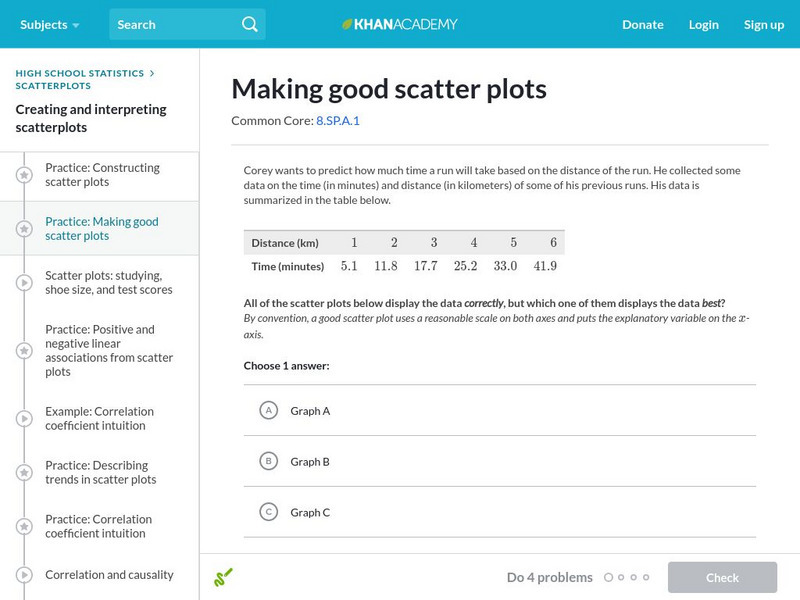
Khan Academy: Making Good Scatter Plots
A good scatter plot has the independent variable on the x-axis and the dependent variable on the y-axis. Also, the scale of both axes should be reasonable, making the data as easy to read as possible. In these practice problems, we...
Texas Instruments
Texas Instruments: Scatter Plots
Basic activity of collecting data and graphing sets of data to see if there is a relationship.
Shodor Education Foundation
Shodor Interactivate: Scatter Plot
Graph ordered pairs and customize the graph title and axis labels. Points are connected from left to right, rather than being connected in the order they are entered.
National Council of Teachers of Mathematics
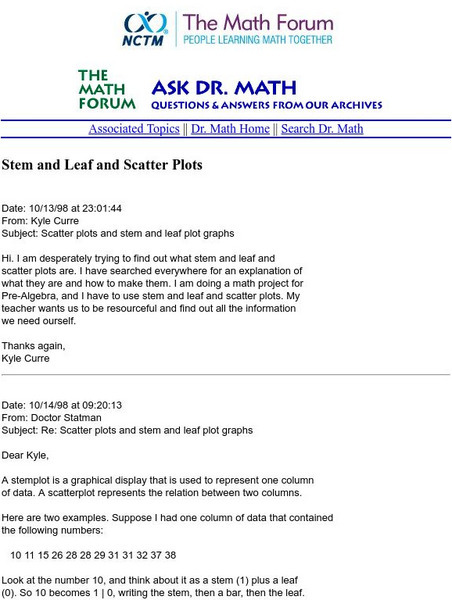
The Math Forum: Nctm: Ask Dr. Math: Stem and Leaf and Scatter Plots
This site is a question/response page which focuses on stem-and-leaf representation and how to construct scatter plots. Dr. Math works through an example and gives commentary notes. Site also contains links for more help.
Texas Instruments
Texas Instruments: Glencoe Algebra 1: Graphing Calculator Investigation Curve
Students will make scatter plots and find the appropriate regression equations that best fit the data.


