Curated OER
Commercial Salmon Fishing
Students work with data about commercial fishing ofsalmon in Alaska. Students gather data, graph it, and analyze it.
Curated OER
Integrated Algebra
In this integrated algebra worksheet, students solve problems covering topics studied during the year. Problems include topics such as slope-intercept, Venn Diagrams, finding the solution to multi-step algebra problems, writing...
Curated OER
Scatterplots
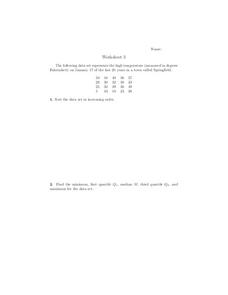
In this scatterplots worksheet, 9th graders solve and complete 6 different word problems with different sets of data. First, they sort the data set in increasing order and find the minimum, first quartile, median, third quartile, and...
Curated OER
Prescient Grading
Do homework grades really determine test scores? Learn whether lines of best fit, correlation coefficients, and residuals can be used to determine test scores when given homework grades. (It would certainly save teachers time in grading...
American Statistical Association
How Tall and How Many?
Is there a relationship between height and the number of siblings? Classmates collect data on their heights and numbers of brothers and sisters. They apply statistical methods to determine if such a relationship exists.
Statistics Education Web
NFL Quarterback Salaries
Use statistics to decide if NFL quarterbacks earn their salaries! Learners study correlation coefficients after using technology to calculate regression equations. Through the data, they learn the meaning of correlation and correlation...
EngageNY
Modeling Relationships with a Line
What linear equation will fit this data, and how close is it? Through discussion and partner work, young mathematicians learn the procedure to determine a regression line in order to make predictions from the data.
Curated OER
Scientific Observation of Force and Acceleration on an Object
In this force and acceleration worksheet, 8th graders answer ten questions based on two graphs. The first graph is a scatter plot, the second is a line graph.
Curated OER
Strike a Pose: Modeling in the Real World (There's Nothing to It!)
Adjust this instructional activity to fit either beginning or more advanced learners. Build a scatter plot, determine appropriate model (linear, quadratic, exponential), and then extend to evaluate the model with residuals. This problem...
Curated OER
Histograms and Statistical Graphics
In this statistics worksheet, students solve 6 data problems. They construct a histogram of given data, they create a frequency polygon, and a stem and leaf diagram. Students create a dot plot and a pie chart for given data sets. On the...
Curated OER
Practice: Word Problems
Congratulations, you've just hit the word problem jackpot! Covering an incredible range of topics from integers and fractions, to percents, geometry, and much more, this collection of worksheets will keep young mathematicians busy...
EngageNY
Mid-Module Assessment Task: Grade 8 Module 6
Make sure pupils have the skills to move on to the second half of the module with a mid-module assessment task. The formative assessment instrument checks student learning before moving on to the rest of the lessons in the unit.
Curated OER
Famous People: Student Worksheet
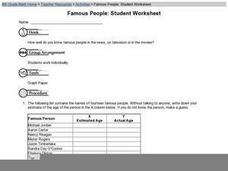
Older learners consider a list of famous people, and they fill in two columns; one in which they guess the celebrities' ages, and another where they look up their actual age. They construct a graph by assigning one of the columns the x...
Curated OER
Lab Sheet: Exponential Growth and Decay
For this exponential worksheet, students gather information from an experiment and plot the data in a scatter plot. Using given formulas, they plot an equation of a line and then compare the graphs. Students observe exponential growth...
Curated OER
Penny Toss - Exponential Growth and Decay
In this penny toss worksheet, students collect statistical data by tossing pennies and then create a scatter plot of the data. They use formulas for exponential growth and decay and then plot the function. This two-page document...
EngageNY
Sampling Variability
Work it out — find the average time clients spend at a gym. Pupils use a table of random digits to collect a sample of times fitness buffs are working out. The scholars use their random sample to calculate an estimate of the mean of the...
Curated OER
Academic Grade 9 Assessment of Mathematics: Algebra I and Geometry
Test your class, or use this 12 page math packet as chapter review. They solve 21 multiple choice problems which require them to graph linear equations, find the volume of prisms and cones, find unknown angles, and determine...
Curated OER
Graph Made Easy-Pre Test Questions
In this graphing pre test worksheet, students complete a set of 10 multiple choice questions. Page is labeled as a pretest, an answer link is provided.
Teach Engineering
Density Column Lab - Part 2
Groups suspend objects within layers of liquids to determine the densities of different liquids and compare them to the densities of objects calculated in Part 1. The groups then carefully test their calculations by layering the liquids...
Teach Engineering
Density Column Lab - Part 1
Mass and density — aren't they the same thing? This activity has groups use balance beams and water displacement to measure several objects. The pupils use the measurements to calculate the density of the objects.
Curated OER
Sports Data for the Classroom
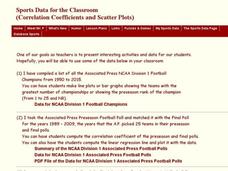
In this algebra activity,students rewrite word problems using algebraic expressions. They collect data and plot their findings on the graph and analyze it. There is an answer key for this activity.
Virginia Department of Education
How Much is that Tune?
Tune in for savings! Scholars investigate pricing schemes for two different online music download sites. After comparing the two, they determine the numbers of songs for which each site would be cheaper.
It's About Time
The Sun and Its Effects on Your Community
Why is the sun round? Examine this question, and others, with your pupils while teaching them how to live in a more earth-friendly environment. Pupils explore Sun composition and discuss how solar wind, sunspots, and solar energy affects...
Willow Tree
Approximating a Line of Best Fit
You may be able to see patterns visually, but mathematics quantifies them. Here learners find correlation in scatterplots and write equations to represent that relationship. They fit a line to the data, find two points on the line, and...


