Polar Trec
Beacon Valley Weather
In Beacon Valley, katabatic winds regularly knock fit adults to the ground. The lesson compares the actual temperatures to the wind chill after factoring in katabatic winds in Beacon Valley. Scholars learn to calculate wind chill and...
Curated OER
Solar Cell Energy Availability From Around the Country
Young scholars determine areas that are the most likely to produce solar energy by using NASA data. In this solar energy instructional activity students analyze plots and determine solar panel use.
Chicago Botanic Garden
GEEBITT (Global Equilibrium Energy Balance Interactive TinkerToy)
Students use the GEEBITT excel model to explore how global average temperatures are affected by changes in our atmosphere in part two of this series of seven lessons. Working in groups, they discuss, analyze graphs, and enter data to...
Michigan State University
Bug Lyphe!
Introduce ecology classes to biodiversity and interdependence in ecosystems with a PowerPoint presentation. Then, they get up-close and personal with the invertebrate world by collecting insects, classifying them, and graphing their...
Curated OER
Linkages Between Surface Temperature and Tropospheric Ozone
Students use data microsets of mean near-surface air temperature and tropospheric ozone residual averages to infer patterns. Students analyze changes in tropospheric ozone and then hypothesize about the consequences of these changes.
Curated OER
Hybrid Vehicles: Cut Pollution and Save Money
Math and science meet in this lesson on hybrid electric automobiles. This 24-page resource provides everything you need for teaching a lesson that compares the use of internal combustion engines to hybrid electric engines. Participants...
Baylor College
Body Mass Index (BMI)
How do you calculate your Body Mass Index, and why is this information a valuable indicator of health? Class members discover not only what BMI is and practice calculating it using the height and weight of six fictitious individuals, but...
National Wildlife Federation
Why All the Wiggling on the Way Up? CO2 in the Atmosphere
The climate change debate, in the political arena, is currently a hot topic! Learners explore carbon dioxide levels in our atmosphere and what this means for the future in the 11th installment of 12. Through an analysis of carbon dioxide...
Mascil Project
Epidemics: Modelling with Mathematics
The Black Death epidemic is responsible for more than one million deaths in the United Kingdom. An inquiry-based activity has young scholars explore the rate of disease spread. They then analyze graphs showing data from epidemics such as...
Nuffield Foundation
Investigating Factors Affecting the Heart Rate of Daphnia
What variables change heart rate? Young scientists observe the beating heart in Daphnia to understand these variables. They make changes in temperature, chemicals, and other factors as they graph the heart rates. Analysis questions help...
Curated OER
Data Analysis and Measurement: Ahead, Above the Clouds
Students explore and discuss hurricanes, and examine how meteorologists, weather officers, and NASA researchers use measurement and data analysis to predict severe weather. They plot points on coordinate map, classify hurricanes...
Curated OER
Collecting Ball Bounce Data
Learners investigate quadratic equations as they use a CBR to collect and analyze data regarding a bouncing ball. Pupils explore different methods for determining the equation of the parabolic path including quadratic regression and...
Curated OER
First Class First? Using Data to Explore the Tragedy of the Titanic
Students analyze and interpret data related to the crew and passengers of the Titanic. They research information on a Titanic database to illustrate specific statistical conclusions, and whether or not social status affected the outcome.
Curated OER
Graphing on the Computer
Learners create a bar graph on the computer using given information from the teacher. They create a bar graph using their own information chart (they need to create one on separate paper first). They utilize Microsoft Excel for this lesson.
Center Science Education
Investigating the Climate
What do graphs of atmospheric gases over time show us? Do they indicate that carbon sources and carbon sinks are not in balance? Up-and-coming meteorologists watch video clips, read information, and analyze data from the HIPPO (HIAPER...
Curated OER
Roots of the Mariana Arc
Plumb the depths of the Submarine Ring of Fire and explore seismic waves with this lesson. Junior geologists simulate s-waves and p-waves, calculate their speeds, and then apply the data to discover the material that makes up inner...
Curated OER
Determining the Density of a Liquid
Young scholars find the density of diet soda and regular soda. In this density lesson plan, students measure the mass of a graduated cylinder with 10 different volumes of each soda. They find the mass of the liquid alone and use the...
Baylor College
Heart and Lungs
With a partner, youngsters measure their pulse and breathing rates, both at rest and after running in place for a minute. While this activity is not novel, the lesson plan includes a large-scale classroom graphing activity and other...
STEM for Teachers
Electromagnificent
This physics pun really hertz, but this STEM lesson plan can help. The inquiry-based activity has young scientists create a testable question about electromagnetic strength; plan and implement their own experiments; and record and...
Curated OER
Data Analysis
In this data analysis worksheet, pupils solve and complete 4 different types of problems. First, they reduce the data provided to find the means, and graph the means in a line graph. Then, students graph the data from each mixture shown...
Code.org
Algorithms Detour - Minimum Spanning Tree
This optional lesson introduces the class to the idea of a minimum spanning tree. The activity focuses on determining an algorithm that will find the most efficient path in a network to transfer data.
Curated OER
What's in the Water? - Stream Side Science
Here is a complete activity in which young biologists or ecologists test the pH, dissolved oxygen, turbidity and temperature of stream water. The class visits an actual stream and makes observations of the site. They use scientific...
Virginia Department of Education
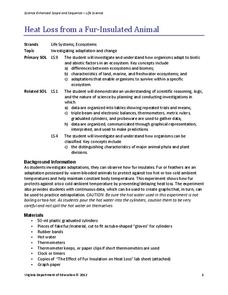
Heat Loss from a Fur-Insulated Animal
How do animals adapt to weather changes? Provide your class with the ability to understand adaptations and body temperature as they participate in this hands on experiment, using fake fur and hot water. Pupils collect data and analyze...
Virginia Department of Education
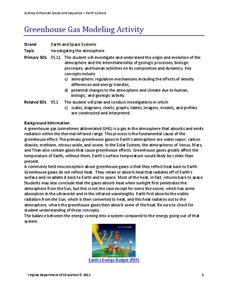
Greenhouse Gas Modeling Activity
Why are greenhouse gases called greenhouse gases? Young Earth scientists learn about greenhouse gases though experimentation in the second installment of a 3-part series. They use lamps to model radiant energy as well as warming through...


