Mascil Project
Chocolate Chip Mining
Canada mines more minerals than any other country in the world. Scholars with a sample must determine how to get the mineral out while preserving as much of the rock as possible. They analyze the data and compare methodology while...
Alabama Learning Exchange
Keep It Movin'!
Learners conduct an experiment to study friction. They complete a KWL chart on friction and conduct an activity about the amount of friction on a moving object. To conclude, pupils create a table or graph of the data collected and they...
Curated OER
Point Graphs
Students experiment with point graphs. In this math lesson, students are divided into groups and perform an experiment to see how high a ball bounces, recording their results on a point graph. Students then answer provided questions.
Curated OER
Computer Graphing
Students research the Internet or create surveys to find graphable data. They collect, organize, analyze and interpret the data. Finally, they choose the appropriate type of graph to display the data and find the measures of central...
Curated OER
See Turtles Nest! See Turtles Hatch!
Students graph data of sea turtles hatching rates from Watamu/Malindi Marine National Park and Reserve in Kenya. In this math lesson, students use real life science data to calculate mean and median values. Students use the data to...
Curated OER
Color Mixing
Students experiment with primary colored water to mix new colors. They record new colors on a simple data sheet and share opinions on their work.
Curated OER
Invasives and Marsh Birds
Students are taught that invasive plant removal can have a variety of impacts. They are shown this by using graphs. Students view maps of vegetation change on Iona Island. They discuss implications of changes on marsh birds using data...
Curated OER
A Closer look at Oil and Energy Consumption
Upper graders analyze basic concepts about the consumption, importation and exportation of the worlds oil production. They create several graphs to organize the data and draw conclusions about the overall use of oil in the world.
Discovery Education
Fuss About Dust
Dust is everywhere around us; it's unavoidable. But what exactly is dust and are certain locations dustier than others? These are the questions students try to answer in an interesting scientific investigation. Working independently or...
Polar Trec
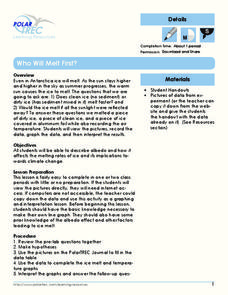
Who Will Melt First?
If the Greenland ice sheet melted, sea levels would rise by about 20 ft; if the Antarctic ice sheet melted, sea levels would rise by 200 ft. Scholars explore ice melting through the analysis of different ice samples, clean and dirty ice....
Teach Engineering
Android Acceleration
Prepare to accelerate your Android. Pupils prep for the upcoming activity in this third installment of a four-part series. The lesson progresses nicely by first introducing different types of acceleration to the class. The teacher...
NOAA
Ocean Layers II
Now that you know the ocean has layers, let's name them. The seventh installment of a 23-part NOAA Enrichment in Marine sciences and Oceanography (NEMO) program covers terminology associated with ocean layers, such as thermocline and...
Curated OER
Matrix Madness!!
Perform operations to add, subtract, multiply and divide matrices. Then solve problems with vectors using matrices. A three day activity: Matrix Madness, Mystical Matrices, and Decode the Encode. The last activity has prizes that the...
NASA
Development of a Model: Analyzing Elemental Abundance
How do scientists identify which elements originate from meteorites? Scholars learn about a sample of material found in a remote location, analyzing the sample to determine if it might be from Earth or not. They study elements, isotopes,...
Beyond Benign
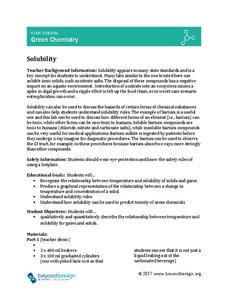
Solubility
Enhance your class' ability to understand solubility. Science scholars examine how temperature and concentration affect solubility using an interesting lab experiment. The introduction and procedure also discuss the relationship between...
Curated OER
Murder in the First Degree - The Death of Mr. Spud
Secondary learners investigate exponential functions in a real-world scenario. They collect data on the temperature of a cooling baked potato, enter the data into lists, and graph the data using a scatter plot before finding an...
Cheetah Outreach
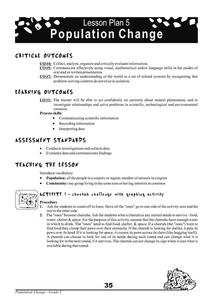
Population Change
Your youngsters become cheetahs in search of food, water, shelter, and space in a fun physical game that does a fantastic job of representing fluctuating species population based on resources available over years.
Curated OER
Solar Kit Lesson #7 - Positioning Solar Panels I: Explorations with Tracking
In this first part of a two-part lesson, learners track and record the sun's azimuth using a solar panel. They graph and analyze the data to identify relationships among the time of day, the altitude and azimuth of the sun, and the...
Curated OER
The Frozen Desert: Graphing and Comparing Climates
Students explore the concept of climate. They use temperature and precipitation data from their area and other regions to construct climate graphs. These graphs are used to help identify factors that influence climate.
Curated OER
Weather
Students create a spreadsheet and chart using data collected. In this weather lesson, students select five cities from their state, including the city they live in. Students take daily temperature readings from all five cities. ...
Curated OER
Climographs
Students identify trends and characteristics of climate zones and specific places within. Then, they graph annual climate trends (primarily Temperature and Precipitation) and create, interpret and extrapolate information based on...
Curated OER
Lessons for Atlatl Users with Some Experience-Grade 6
Sixth graders experiment with an atlatl and dart. In this sixth grade data management mathematics instructional activity, 6th graders explore and determine the most suitable methods of displaying data collected from their...
Curated OER
Paper Airplane Science
Fifth graders recognize the need to follow the scientific method carefully and be aware of variables in experiments. In this airplane lesson, 5th graders design and test an airplane, and complete a data sheet. Students retest five times...
Curated OER
Graphing Weather
Students make a graph. In this weather lesson plan, students fill in a KWL chart about different types of weather. Students watch a PowerPoint presentation about weather and natural disasters and where these types of weather are common....


