Science 4 Inquiry
The Yin and Yang of Photosynthesis: Day vs. Night
Floating fragments of elodea can grow even without roots. Young scientists use eldoea plants to observe the oxygen production from photosynthesis. They study the difference between having access to high amounts of light and low amounts...
Curated OER
Determining the Density of a Drop of Water-A Graphing Exercise
Middle schoolers determine the density of 1 drop of water. In this determining density lesson plan, students determine the mass and volume of a drop of water in the lab using appropriate lab techniques and calculate the density of a drop...
Curated OER
Clouds
Students explore basic cloud types and the weather associated with each one. In this earth science lesson, students participate in numerous activities including going outside to observe the clouds they see, making a cloud in a jar,...
Curated OER
Pick a Pet
Students construct a pictograph of favorite pets. In this pets and graphing lesson, students discuss their favorite pet and use animal magazines to find their favorite pets and cut them out. Students create a pictograph using the pictures.
Curated OER
What is a Seed?
First graders identify the parts of a seed. In this plant biology lesson, 1st graders are given a seed and identify each part of the seed by using a hand lens. Students plant a seed and graph the growth.
Curated OER
Bacteria and Illness
Students research information on bacterium and their relationship to food borne diseases. In this science lesson plan, students complete internet research to construct and analyze the growth cure of common bacterium and food-borne...
Curated OER
Wind
Learners make a wind vane, anemometer, wind spiral, and wind streamer to calculate wind movement. In this wind lesson plan, students test each of their wind instruments, and graph the results of the wind speed in different locations.
Curated OER
A Fishy Tale
Eighth graders do a research project on a particular species of Atlantic seafood and record and graph information pertaining to commercial landings of that species of seafood. They use a website and an Appleworks spreadsheet.
Curated OER
I'm All Mixed Up
Middle school scientists compare and contrast heterogeneous and homogeneous mixtures. They differentiate solutions, colloids, and suspensions by examining samples of each. Note that the bulk of the lesson plan directs you how to...
Curated OER
Examine Methods of Reporting Research Results
Students analyze a research report and the list of components needed in a research report and then identify those components based on a set of standards using the scientific method. They collect data which can be used for a graphical...
Curated OER
Re-Presenting Race in the Digital Age
Teen-aged scientists analyze a graphic organizer of how trash is removed from New York City and then answer standard questions about a graph and a diagram. Resources are mentioned, but there are no links to these resources, so you will...
Curated OER
Modeling Linear Relationships
Young scholars graph lines using the slope and y-intercept. In this algebra lesson, students create data using tables and equations. They use their data to make predictions and draw conclusion.
Curated OER
Sunrise-Sunset
Young scholars gather data, make and share predictions about the time of sunrise ans sunset in their area. Patterns are analyzed and shared with students from other areas.
Curated OER
Air Quality
Young scholars participate in many activities examining air quality. They examine the purpose of a greenhouse and make predictions. They also collect data and make graphs and charts.
Curated OER
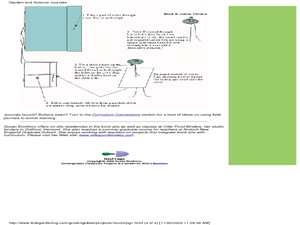
Making Field Journals
Young scholars follow a bookmaking format to create a book and use it as a garden journal. In this science journal lesson, students follow book making directions to create a garden and science journal.
Curated OER
Bounce Back - The Long and Short of It
Upper elementary scientists test basketballs with differing amounts of air to find if inflation affects bounce height. The instructional activity introduction poses the question of whether or not the composition of a ball determines...
Curated OER
"You're Hired!'
Students investigate linear programming using the TI. In this algebra lesson, students collaborate and graph linear inequalities on a TI. They analyze their data and present it to the class.
Curated OER
Pendulums
First-time physicists experiment with pendulums in this physics lesson. They vary the weight of the bob, record how long each takes to complete ten period swings, and then calculate the time for one period. They repeat the procedure,...
Curated OER
Bird Beaks
Fourth graders explore the characteristics of organisms and how these influence their ability to survive in particular habitats. Students perform experiments with types of bird beaks and graph their results. Students explore familiar...
Curated OER
What Are You Eating?
Discover the calorie content of foods by observing how much heat they produce in water. If you have a calculator-based laboratory (CBL™) insturment for collecting data, then this laboratory worksheet will not need any changes. If not,...
Curated OER
The Effect of Temperature on Cricket Chirping
High schoolers examine the effect of temperature on how often crickets chirp. In groups, they complete the experiment and answer lab discussion questions. They create a graph of temperatures and the amount of chirps and discuss the results.
Curated OER
Back In The "Old Days"
Fifth graders collect data during their worker interviews while in groups to compile job changes. They analyze the data to determine the categories of changes, patterns/trends of change and future projections. Each group then develops a...
Curated OER
Energy Conservation Lesson 1: Fossil Fuels and the Ticking Clock
Students explore energy production by participating in a class discussion. In this renewable energy lesson, students discuss the differences between solar, coal, wind and fossil fuel energy sources and why some are better for the...
Curated OER
Dissolved Oxygen and Temperature
Young scholars are shown how temperature affects dissolved oxygen and they create a graph showing this relationship. They think about the adaptations of animals to live in different water temperatures. Students test four different water...


