Curated OER
Surveys
Students collect data from middle school survery. They tabulate percentages by grade level. They create a graph to display the survey results.
National Research Center for Career and Technical Education
STEM: Lou-Vee Air Car
A comprehensive lesson plan on acceleration awaits your physicists and engineers! Two YouTube videos pique their interest, then sample F=ma problems are worked and graphed. The highlight of the lesson plan is the building of a Lou-Vee...
Curated OER
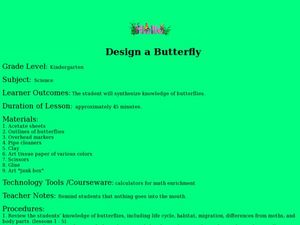
Design a Butterfly
Students access prior knowledge of butterflies. In this butterfly lesson, students create butterflies and compare and contrast their butterflies. Students describe the various body parts.
Curated OER
Creeping
Young scholars observe, measure, and graph a model of slow down slope movement representing soil creep. This task assesses students' abilities to collect, record, and organize data, set up graph axes, plot data points, draw line graphs,...
Curated OER
Weather v. Climate
Ninth graders discuss the differences between climate and weather as a class. Using data they collected, they create a graph of the data to share with the class over a specific time period. They compare and contrast this data with...
Curated OER
Finding the Basal Area of a Forest Plot to Determine Stocking Levels
Learners use graphs and plots to measure the basal area and stocking levels. In this graphing instructional activity students work in the field the use their data to help them complete a lab activity.
Curated OER
Keep It Cool
Pupils complete a science experiment to study insulation, heat transfer, and permafrost. In this permafrost study lesson, students design and test a soda insulator. Pupils graph their class data and discuss the results. Students discuss...
Curated OER
Testing Battery Combinations
Fourth graders examine the required combinations of plates and predict which combination will generate the most and least current and voltage. They use an ammeter and experiment with combinations of their own testing and record each...
Curated OER
Whole Lotta Shaking Going On
Students explore earthquake activity in California. They observe the historical data and create databases and graphs of the earthquakes. Students analyze the data and form a hypothesis about future earthquakes.
Curated OER
Comparing Temperature, Pressure, and Humidity
Students investigate data on temperature, pressure, and humidity by downloading information from the ARM Website. Working in groups, they discover how weather impacts life in each of the ARM sites. They record weather data in their...
Curated OER
Sunspot Activity
In this space science worksheet, students find the data that is needed to help them acquire the knowledge concerning sunspots through observation and data collection.
Curated OER
Trouble in the Troposphere
Students create graphs using NASA data, compare ozone levels of several U.S. cities, analyze and evaluate the data and predict trends based on the data, and discuss and describe how human activities have modified Earth's air quality.
Curated OER
Believe It...Or Not
Pupils critically analyze data regarding climate changes using a glossary of terms generated by examination of climate related articles. They examine and graph climatic data, and discuss, hypothesize and test apparent discrepancies in...
Curated OER
Height of Bounce
Eighth graders determine the relationship between the height of bounce of a ping-pong ball and the height from which it was dropped. They are assessed on the ability to record and interpret data, graph data, make predictions, and make...
Curated OER
For The Birds
Seventh graders list the features of an ecosystem and identify local bird species. In this bird lesson students work in groups to formulate a hypothesis and test their theory by collecting and analyzing data.
Curated OER
Temperature and Pressure
Middle schoolers conduct an experiment to determine the relationship between pressure and temperature. In this physical science lesson, students collect data and graph them. They compare the results of Celsius and Fahrenheit data sheets.
Curated OER
Are you an Energy Saver STAR?
Young scholars examine how to use energy more efficiently in their own home. They collect data from their home, complete a chart, read a power meter, interpret the data from an electric and gas bill, and create a poster demonstrating how...
Curated OER
Ocean Botttom Profile
Students interpret a graph of ocean depths and topographic features. This task assesses students' abilities to interpret figures, organize and represent data, apply knowledge of scale to a profile, and apply theoretical knowledge.
Curated OER
Testing the Waters
Eleventh graders examine a local body of water. In this science lesson, 11th graders collect water samples to test. Students analyze the data and make conclusions. Students create tables and graphs of the data.
Curated OER
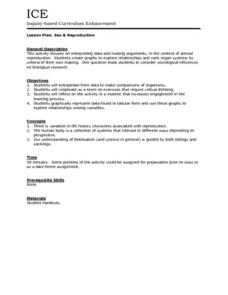
Sex & Reproduction
Students examine animal reproduction by interpreting data and making arguments and then create their own graphs to explore relationships of organ systems. This lesson plan includes an individual worksheet and a reflective review...
Curated OER
Weather Report Chart
Young scholars complete a weather report chart after studying weather patterns for a period of time. In this weather report lesson plan, students measure temperature, precipitation, cloud cover, wind speed, and wind direction for a...
Curated OER
The Greenhouse Effect
Seventh graders investigate the temperature change in open and closed containers. In this earth science instructional activity, 7th graders relate this lab activity to greenhouse effect. They create a line graph from data collected in...
Curated OER
Measuring and Recording Weather
Students examine instruments used to measure weather, record the data, and post it to an online weather report. They include a 24 hour prediction, keep a weather log, and graph the data.
Curated OER
Rate of Solution
Eighth graders determine the amount of agitation necessary to dissolve various sized sugar particles. This task assess students' abilities to collect, organize, and interpret data, create appropriate graphs, predict future events based...


