Illustrative Mathematics
US Garbage, Version 1
An interesting example of a discrete function and how it is applies to the real world. This could easily make a good collaborative lesson with an environmental science class. Practice reading a table and drawing a scatter plot make up...
Beyond Benign
Water Bottle Unit
How much plastic do manufacturers use to create water bottles each year? The class explores the number of water bottles used throughout the years to determine how many consumers will use in the future. Class members compare different...
Towson University
Case of the Crown Jewels
Can your biology class crack the Case of the Crown Jewels? Junior forensics experts try their hands at DNA restriction analysis in an exciting lab activity. The lesson introduces the concept of restriction analysis, teaches pipetting and...
Kenan Fellows
Using Water Chemistry as an Indicator of Stream Health
Will this water source support life? Small groups test the chemistry of the water drawn from two different sources. They then compare the collected data to acceptable levels to draw conclusions about the health of the source. The...
Pingry School
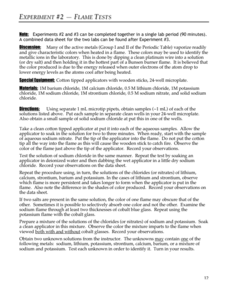
Flame Tests
Light a fire in your pupils! Scholars conduct a flame test and observe the emission spectra of several different salts in an enlightening hands-on investigation. They use their observations to make comparisons and conclusions about the...
Annenberg Foundation
Geometry 3D Shapes: Euler's Theorem
How do you get a theorem named after you? Euler knows what it takes! The third lesson of five asks pupils to use an interactive activity to compare the faces, vertices, and edges of seven different three-dimensional solids. They use...
Serendip
Understanding and Predicting Changes in Population Size – Exponential and Logistic Population Growth Models vs. Complex Reality
Salmonella poisoning impacts over 200,000 people in the United States each year. Scholars learn about the growth of these bacteria using multiple approaches. Then they apply the same growth calculations to endangered species and think...
National Research Center for Career and Technical Education
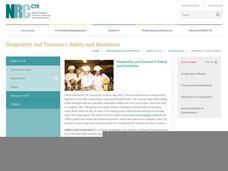
Hospitality and Tourism 1: Safety and Sanitation
Math and science come alive in this career-related instructional activity on sanitation. Along the way, learners explore bacterial growth rates using exponential notation and graphs. A link to a very brief, but vivid video shows just how...
Curated OER
Investigate Pine Creek!
Students are invited to become detectives in this Web-Integrated Science Environment (WISE) as they explore a local creek, its environment and ongoing status. Students participate in field trips, acquisition of data through water testing...
Curated OER
Antarctica’s Melting and the Affect it has on the Ocean
Students calculate how much mass is lost and gained by Antarctica yearly. In this earth science lesson, students graph and analyze data from the given handout. They explain how this affects the world climate.
Curated OER
Which Fish Where?
Here is a lesson outline that prompts elementary learners to graph and analyze data regarding fish caught along the Hudson River. They will review vocabulary and complete 2 worksheets which can be accessed by clicking on the provided links.
Curated OER
Atomic Mass of Candium
By focusing on "Candium", pupils can work through this guide to learn more about different isotopes. The teacher will supply M&M's, Skittles and Reeses Pieces to provide data about mass and abundance.
Curated OER
Anatomy of an Element
Learners discuss matter and atoms using this resource. First, they look at a website describing atoms. Then, they learn about the periodic table and discuss how it is organized. Finally, they create a comic strip to display their...
WK Kellogg Biological Station
Plotting Phenology
Finally, a worksheet that involves more than filling in some blanks. Your budding ecologists must graph and analyze three sets of data, then synthesize the information as they think about the impacts of plant reproduction on insects and...
Curated OER
Weather's Outer Limits
Students make educated guesses and explain their reasoning and compile, graph, and map weather data. They then study environmental weather extremes on earth and discover that many variables determine climate.
Curated OER
Weather Lesson
Learners discuss the weather conditions. They read thermometer, rain gauge, barometer, and wind direction and speed. They record observations of weather conditions and enter information into data base on the computer.
Curated OER
Acid-base Indicators
There is a chart to complete with results of the titrations for the 14 different pH indicators. There are also nine questions for data analysis, and then four problems requiring equations, molarities, and pH values.
Curated OER
Probability: The Study of Chance
Students conduct an experiment, determine if a game is fair, and collect data. They interpret data, then display line graph. They conduct analysis of game for probability.
Curated OER
Sundials and Shadows - What Can They Teach Us About Seasons?
Students collect and analyze data relating to seasonal changes. They view a video, research web sites and build a sundial to collect their data.
Curated OER
Endangered Species
Ninth graders graph data in order to compare the number of extinct species and a rise in human population. They analyze the data collected. Students are encouraged to infer the relationship.
Coastal Carolina University
Osmosis and Diffusion Lab: Honey I Blew Up the Bear
Beginning biologists explore passive transport through two demonstrations and a hands-on inquiry. Spray air freshener from one spot in the classroom and have class members raise their hands as the scent reaches them. Also, place a teabag...
Curated OER
Latitude
Young scholars examine the theory of finding latitude and discuss the uses of an astrolabe, cross-staff and octant. They determine an Astronomical Table for their classroom.
Curated OER
Lead and Mercury: Comparing Two Environmental Evils
High schoolers in chemistry or health courses look at the material safety data sheet (MSDS) and periodic table of elements to gather information about mercury and lead, two toxic materials that have been found in food products. They read...
Curated OER
Sunrise-Sunset
Young scholars gather data, make and share predictions about the time of sunrise ans sunset in their area. Patterns are analyzed and shared with students from other areas.


