Achieve
Ivy Smith Grows Up
Babies grow at an incredible rate! Demonstrate how to model growth using a linear function. Learners build the function from two data points, and then use the function to make predictions.
Royal Society of Chemistry
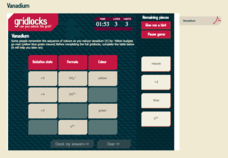
Vanadium
Introduce your chemistry scholars to the periodic table's Goddess of Beauty! Through an interactive that highlights the transition metal vanadium, learners discover the colors produced in solution as vanadium changes oxidation state....
Pingry School
Comparing Activities of Selected Metals
Don't overreact! A simple experiment demonstrates chemical reactions as scholars mix chemical solutions and metals in a large well plate. They note all changes to the metals, solutions, precipitate, colors, and more. A full data table...
Pingry School
Replacement of Hydrogen by a Metal
As the most abundant element on the earth, hydrogen requires no replacement. Yet scholars learn to replace hydrogen with a metal to liberate the hydrogen gas. A simple procedure and data table include the necessary information and...
Pingry School
Solubility Product of an Ionic Compound
How do scientists determine when a solution is fully saturated? Scholars address the topic as they observe patterns of precipitation in various concentrations of ions. Using a well plate, pipette, and common chemicals, they collect data...
Institute of Electrical and Electronics Engineers
Trebuchet Toss
Young engineers work in teams to design and build their own trebuchets according to certain criteria; they must be able to launch a mini marshmallow accurately into a pie tin. Background reading material, a planning sheet for trebuchet...
Carnegie Mellon University
Renewables Workshop
Youngsters examine resource maps to find out which states are using solar and wind power and discuss as a class various other renewable energy sources. They use a provided data table to record pros and cons to each technology, build and...
Port Jefferson School District
Hurricane Katrina
Young scientists track Hurricane Katrina across the Atlantic Ocean as they learn about these destructive forces of nature. Provided with a table of data tracking the location and conditions of Katrina over a one week span, students plot...
Rensselaer Polytechnic Institute
Molecules to the Max!—Educators Resource Guide
From molecules to nanotubes, an engaging unit explores the world of tiny science. Fifteen hands-on experiments and lessons engage young scientists as they learn chemistry. Discussions, worksheets, and data analysis reinforce the concepts...
Curated OER
Tables, Charts and Graphs
Students examine a science journal to develop an understanding of graphs in science. In this data analysis lesson, students read an article from the Natural Inquirer and discuss the meaning of the included graph. Students create a...
Curated OER
Aquatic Science and IPC
Students explain the importance of water in our daily lives. For this aquatic science lesson, students identify different ways to purify water and make it potable. They design and construct a water filter based on researched information.
Curated OER
Evaluating Data
In this data worksheet, students learn how to organize the data collected during an experiment and practice finding patterns. Students graph a table of experimental data and complete 1 short answer question.
Curated OER
Data Analysis
In this data analysis worksheet, 8th graders solve and complete 4 different problems that include determining the line of best fit for each. First, they write the prediction for an equation for each situation described. Then, students...
Curated OER
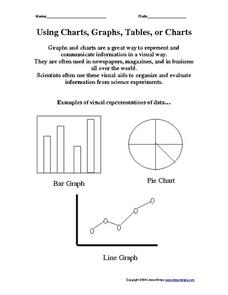
Using Charts, Graphs, Tables, or Charts
In this charts, graphs and tables activity, students view 3 different types of visual representations of data, make a list of 20 items and decide how the items can best be put together in groups to make a graph, chart or table. Students...
Curated OER
Arthropod Data Collection
Students describe the life cycle of various bugs as well as their predators and feeding habits. The class participates in a discussion of the various methods scientists use to gather data including research and experiment. After...
Curated OER
Canada at a Glance
Stjudents examine the statistics in a Canadian publication for use in graphs. They develop their own questions based on tables and graphs found in this publication..
Curated OER
Interpreting and Displaying Sets of Data
Students explore the concept of interpreting data. In this interpreting data lesson, students make a line plot of themselves according to the number of cubes they can hold in their hand. Students create their own data to graph and...
Curated OER
Big Boats Up The River
Using boats along in the Port of Albany as the focus, learners practice adding single-digit numbers and interpreting data. This lesson comes with the worksheets, resource links, and other materials to make it a worthwhile experience.
Curated OER
Get a Half-Life Student Worksheet
Young scientists use a worksheet to help them perform a lab on the decay of a radioactive element. The worksheet serves as both a task guide and a lab sheet for pairs of learners. This activity requires a calculator and has excellent...
Curated OER
Human Body Series - Cardiovascular System
Pump up your class while studying the cardiovascular system with this pair of activities. In one, learners record heart rates during different actions. In the second, they read kid-friendly heart health articles online and then write a...
Curated OER
Pollution and Environmental Studies- Daily Water Use
In this environmental studies worksheet, students create a data table to discover how much water each person uses on a daily basis and what it is used for. They complete a post activity to make and test solutions for pollution using a...
University of Pennsylvania
Evolution by Natural Selection
A diagram, data table, and reading passage top this resource. Through it, biology beginners are introduced to the concept of natural selection. They answer some questions and then participate in a simulation using fabric as a habitat and...
Curated OER
Round and Round
Learners interpret data from a three-dimensional array of current monitors to determine an overall pattern of water circulation. They hypothesize what effect an observed water circulation pattern might have on seamount fauna. A very...
Curated OER
Enzymes at Work
The first four questions on this assignment require the use of critical thinking skills to apply the action of enzymes to different situations. Biologists then interpret enzyme activity data in a table and answer questions about it. This...


