Curated OER
Science and Technology
Students research inventions that have been created. In this historical technology lesson, students read the Harcourt Brace social studies textbook and discuss how inventors used graphs to display data. Students create a table to write...
Curated OER
Using Radiosonde Data From a Weather Balloon Launch
Student use radiosonde data from a weather balloon launch to distinguish the characteristics of the lower atmosphere. They learn the layers of the atmosphere. They graph real atmospheric data.
Curated OER
Weather
Students create a spreadsheet and chart using data collected. In this weather lesson, students select five cities from their state, including the city they live in. Students take daily temperature readings from all five cities. ...
Curated OER
Elements 'R' Us
Sixth graders participate in a Web Quest in order to examine the periodic table of elements. After collecting information about an element of their choice, they share with group members what they have learned. Groups create class...
Curated OER
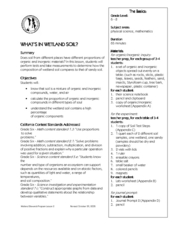
What's in Wetland Soil?
Students examine the organic and inorganic components of soil. For this environmental science lesson, students identify the factors that influence soil formation. They collect soil samples, conduct tests, and analyze the results.
Curated OER
What's My Pattern?
Students recognize, describe and extend patterns in three activities. They organize data, find patterns and describe the rule for the pattern as well as use the graphing calculator to graph the data to make and test predictions. In the...
Curated OER
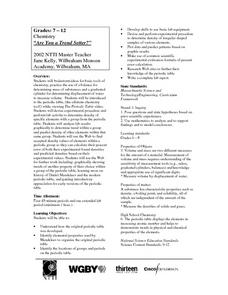
Are You a Trend Setter?
Learners are introduced to the periodic table of elements. They devise and perform and experiment in which they determine the density of specific elements. They use their results to predict the density of other elements in the same group.
Alabama Learning Exchange
Keep It Movin'!
Learners conduct an experiment to study friction. They complete a KWL chart on friction and conduct an activity about the amount of friction on a moving object. To conclude, pupils create a table or graph of the data collected and they...
Curated OER
200 Years and Counting: How the U.S. Census Tracks Social Trends
Students examine the process of census taking in the United States. For this "200 Years and Counting" lesson, students examine the data collection process, look at an example of a census form, analyze data, and learn what the information...
Curated OER
The Solar Cycle
Students research the solar cycle. In this Science lesson, students use the internet to investigate the solar cycle. Students produce a spreadsheet and graph from the information collected.
Curated OER
The Affect of Water Temperature on Living Organisms
Students examine the environmental impact of global warming. In this environmental science lesson, students design and conduct an experiment about the effect of temperature on paramecia. They write a lab report about their experiment.
Curated OER
Biospheres in Your Backyard
Students collect data from a local river biome. They use the information for metric conversion and graphing equations. They study the components of what makes up a biosphere and how math is used to analyze one.
Curated OER
Introduction to Science
Seventh graders investigate scientific methods to solve problems. They demonstrate creating data tables and graphs. They study the role of a scientist and the importance of safety in a science lab. They distinguish between an...
Curated OER
Where do Plants Get their Food?
In this where do plants get their food worksheet, students design an experiment that will disprove the idea that plants obtain their food from soil. Students will set up their experiment and design a data table that will record data over...
Virginia Department of Education
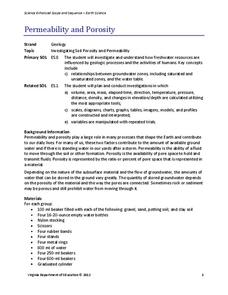
Permeability and Porosity
Covering both permeability and porosity, scholars perform a hands-on experiment testing various soil types. The material includes a pre-lesson worksheet to help focus pupils on the task at hand.
Curated OER
Adaptation Investigation - Extreme Beaks
Find photos of bird beaks or show a prepared four slide PowerPoint, "Extreme Beaks" to introduce your class to this special animal adaptation. Provide them with a data table and supplies to try gathering food with tools that each...
Curated OER
Glaciers: Then and Now
A large data table is given to your elementary earth scientists in which they record observations that they make while viewing pictures of Alaskan glaciers. They compare and contrast recent photos with older photos. Hold a discussion...
Curated OER
Elastic Recoil in Arteries and Veins
A lab in which high schoolers examine the difference between arteries and veins. Budding biologists will find out which blood vessel can stretch furthest, recording their data in a table then answering several questions evaluating their...
Curated OER
First Class First? Using Data to Explore the Tragedy of the Titanic
Students analyze and interpret data related to the crew and passengers of the Titanic. They research information on a Titanic database to illustrate specific statistical conclusions, and whether or not social status affected the outcome.
Curated OER
Pendulum Lab in 9th Grade Physical Science
Ninth graders conduct experiments to determine what affects the rate of a pendulum's swing. Working in small groups, they identify an independent variable to study and create an experiment to test their hypothesis. When tests are...
University of Washington
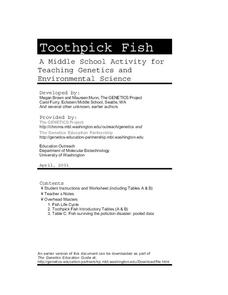
Toothpick Fish
With colored toothpicks representing genes, youngsters practice passing them through generations of fish and learn about heredity. Consider this as an introductory activity since it does not represent recessive genes with lowercase...
Curated OER
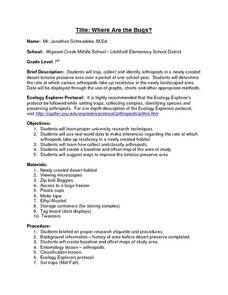
Where Are the Bugs?
Students trap, collect and identify arthropods in a newly created desert tortoise preserve area over a period of one school year. They determine the rate at which various arthropods take up residence in the newly landscaped area. Data is...
Oregon State
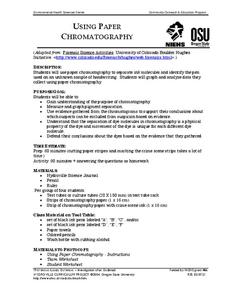
Using Paper Chromatography
Through the analysis of paper chromatography to separate ink from the pen found at the crime scene, learners analyze the different stains and through calculations determine the thief.
American Chemical Society
Using Color to See How Liquids Combine
Blue-tinted water is added to unknown liquids that have been tinted yellow to find out how they interact. This is a memorable activity that is part of an investigation on the properties of liquids, which is part of a unit on the...


