NOAA
Ground-truthing Satellite Imagery with Drifting Buoy Data
Ground-truthing ... is it even a word? The last installment of a five-part series analyzes how scientists collect sea surface temperature data. Scholars use government websites to compare temperature data collected directly from buoys...
Curated OER
Remote Sensing and Landsat Satellite Imagery
Middle schoolers comprehend how satellites use remote sensing to produce images. They use supervised classification with Landsat images. Students recognize that the earth's surface has different basic land surfaces that reflect/emit...
Discovery Education
Satellite Telemetry
Satellites require rockets to launch, but it doesn't take a rocket scientist to understand them. Future engineers learn about how satellites send data to Earth and how to interpret satellite images. They see how radio waves play a role...
NASA
NASA Visualization Explorer
Read some of the most up-to-date information available from NASA's current Earth and space research! Along with showcased stories, you will find computer animations and satellite images that help you to view what humans cannot see with...
Curated OER
Message in a Bottle - A Satellite Journey through the Gulf Stream
The Gulf Stream has historically provided humans with a faster trade route because of its swift-moving waters. It continues to be a source of information and fascination for oceanographers today. As your class views this collection of...
Curated OER
Exploring Biomes Lesson 1: Mapping Biomes
Environmental science learners examine satellite imagery of temperature, vegetation, precipitation, and productivity. They use these maps to understand how scientists divide the planet into major biomes. As part of a larger unit on...
Curated OER
Using Satellite Imagery to Discuss the Science Behind Brazilian Deforestation
Students can delve into earth science by using satellite imagery to learn about the deforestation of the Brazilian rainforest.
Association of American Geographers
Project GeoSTART
Investigate the fascinating, yet terrifying phenomenon of hurricanes from the safety of your classroom using this earth science unit. Focusing on developing young scientists' spacial thinking skills, these lessons engage...
Space Awareness
A View From Above
Analyzing and interpreting satellite data takes knowledge and patience. Through a detailed lab investigation, young scholars learn the process of analyzing this data. They use technology to create color images and maps from real...
Curated OER
Image Classification
Students explore what are "multi-spectral" or "multi-band" images? They investigate how landscapes change over time- at least over the time-span of satellite imagery, particulary due to human influences. Students explore how to train...
Curated OER
Amelia the Pigeon: As a Pigeon Flies
Students follow Amelia's adventure on a satellite image. They use measuring and math skills to determine the distance she traveled.
Curated OER
Upwelling in the World Ocean
Here is a fascinating topic: the upwelling of ocean waters. Oceanography pupils learn what mechanisms cause upwelling, types of upwelling, and the effects on marine life. Colorful satellite imagery and informative diagrams bring this...
Curated OER
Ocean Circulation
In this physical oceanography PowerPoint, viewers learn about ocean circulation, sea surface temperatures, and salinity. Relationships among these aspects are explained, as well as their impact on the atmosphere and climate. Each slide...
National Wildlife Federation
Quantifying Land Changes Over Time Using Landsat
"Humans have become a geologic agent comparable to erosion and [volcanic] eruptions ..." Paul J. Crutzen, a Nobel Prize-winning atmospheric chemist. Using Landsat imagery, scholars create a grid showing land use type, such as urban,...
Curated OER
The Global Precipitation Measurement Mission (GPM) Lesson
Introduce your class to one of the ways that technology is benefiting humanity. The Global Precipitation Measurement Mission involves the data collected by nine satellites from different countries with a united focus on studying world...
Space Awareness
Valleys Deep and Mountains High
Sometimes the best view is from the farthest distance. Satellite imaging makes it possible to create altitude maps from far above the earth. A three-part activity has your young scientists play the role of the satellite and then use...
Curated OER
The Coastal Ocean: Estuaries and Continental Shelves
Amazing high-quality satellite imagery, photos, informational graphs, and detailed diagrams comprise this presentation on the movement of estuaries and the continental shelf. Data used as an example is from The Chesapeake Bay and because...
Columbus City Schools
Constructive and Destructive Geologic Processes
Show the class the world as they've never seen it before—from way above! Learners try to unravel the mysteries presented by rich satellite imagery, learn to interpret topographic maps, and study erosion by constructing their very...
Curated OER
Storm Clouds-- Fly over a Late Winter Storm onboard a NASA Earth Observing Satellite
Students study cloud data and weather maps to explore cloud activity. In this cloud data lesson students locate latitude and longitude coordinates and determine cloud cover percentages.
Midnight Martian
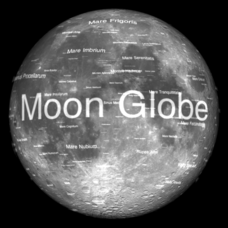
Moon Globe
Not just a simple globe of the moon, this interactive version allows you to choose lighting according to the location of the sun, views from different positions on Earth, and more! Satellite images and topographic data have been combined...
Curated OER
Satellite Sense
Students look at data to understand how it is interpreted by scientists. In this satellite sense instructional activity, students complete worksheets based on radar and satellite images. Students work in groups of two to diagram a...
Curated OER
Interpreting Satellite Images
Students identify differences between photography and satellite imagery space.
Curated OER
A Comparison of Cloud Coverage Over Africa
Students use a NASA satellite data to contrast amounts of cloud coverage over different climate regions in Africa. They explore how Earth's major air circulations affect global weather patterns, and relate to local weather patterns.
Curated OER
A Comparison Study of Water Vapor Data to Precipitation over North America
Students use NASA satellite data to compare water vapor over the United States. For this data analysis lesson students use an Excel spreadsheet to map their data.


