Curated OER
Natural Selection Simulation
Students simulate the changes in a natural population of birds or other species. They establish baseline data of population fluctuation for a closed population with a stable food supply. They graph the data to complete their mutations.
Curated OER
Foodborne Illness Outbreak Investigation
Students demonstrate how epidemiological investigations of outbreaks are performed. They illustrate the principles of hypothesis formation and testing by epidemiologic study in the setting of an acute foodborne disease outbreak.
Curated OER
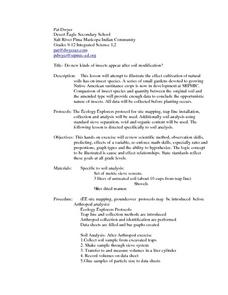
Do new kinds of insects appear after soil modification?
Students explore and experiment with the concept do new kinds of insects appear after soil modification. They assess and review scientific methods of observation, predicting, variables, math skills, ratio, proportions, graphs and the art...
NASA
Measuring Dark Energy
You're only 10 minutes late? Do you know how much the universe has expanded in those 10 minutes? Scholars graph supernovae based on their redshift and see if the results verify Hubble's Law. If it does confirm it, the universe is...
Curated OER
Does The Type of Mulch Used Affect Plant Growth?
Students measure, record and graph the plants they grow in a controlled setting. They feed and water the plants as needed and use the scientific method to evaluate the growth.
Curated OER
How Toxic Is It?
Students participate in an activity in which they investigate the scientific method and seed germination as well as practice graphing and metric measuring skills. Students examine toxicity by exposing Wisconsin Fast Plants seeds to toxic...
Curated OER
Investigating the Probability
Students investigate probability using coins and dice. They collect data, graph, organize and interpret data. They predict, describe, compare, compute and draw conclusions based on what they observe and record.
Curated OER
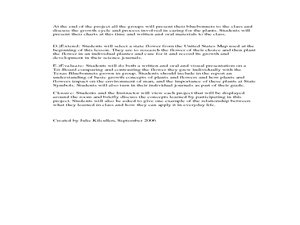
How Does Your Blue Bonnet Grow?
Learners explore the conditions needed to grow Texas Blue Bonnets. In this Blue Bonnet planting lesson, students recognize the differences in Texas Blue Bonnet. Learners record their findings in a graphs and analyze their results.
Curated OER
The Survey Says
Young scholars experience the development of statistical data. In groups, they construct a survey questionnaire for a target audience. Students produce the questionnaire, distribute it, collect it, and tabulate the data. Using EXCEL,...
Curated OER
Trouble in the Troposphere
Students Use data sets from MY NASA DATA to produce graphs comparing monthly and yearly ozone averages of several U.S. cities. They analyze and evaluate the data and predict trends based on the data. In addition, they discuss and...
Curated OER
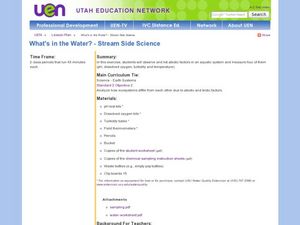
What's in the Water? - Stream Side Science
Here is a complete activity in which young biologists or ecologists test the pH, dissolved oxygen, turbidity and temperature of stream water. The class visits an actual stream and makes observations of the site. They use scientific...
Curated OER
Snell's Law
Students determine whether the index of refraction of sample of Corn Syrup meets Federal standards. This task assess students' abilities to explain the procedures for investigation, plan for recording and organizing observations and...
Curated OER
Concentration and Reaction Rates
Students investigate how varying the concentrations, volumes, and other factors affects reaction rates. Students design and conduct investigations to obtain data used to create graphs of an uncatalyzed reaction vs. a catalyzed reaction....
Curated OER
Whole Lotta Shaking Going On
Students explore earthquake activity in California. They observe the historical data and create databases and graphs of the earthquakes. Students analyze the data and form a hypothesis about future earthquakes.
Virginia Department of Education
Average Atomic Masses
Facilitate learning by using small objects to teach the principles of atomic mass in your science class. Pupils determine the average mass of varying beans as they perform a series of competitive experiments. They gather data and...
Curated OER
Electric Circuits
Students determine the power dissipated in the combination of two resistors connected in series to a 6 volt battery. This task assesses students' abilities to develop procedures for an investigation, develop a plan for recording and...
Curated OER
The Greenhouse Effect
Seventh graders investigate the temperature change in open and closed containers. In this earth science instructional activity, 7th graders relate this lab activity to greenhouse effect. They create a line graph from data collected in...
Curated OER
Trouble in the Troposphere
Students create graphs using NASA data, compare ozone levels of several U.S. cities, analyze and evaluate the data and predict trends based on the data, and discuss and describe how human activities have modified Earth's air quality.
Curated OER
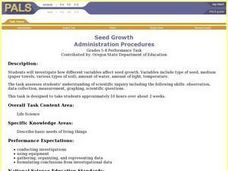
Seed Growth
Students develop an independent procedure to investigate the germination of two types of seeds. Students must construct data tables or charts to record observations and results, graph the data, and analyze the data.
Curated OER
Disease Lesson
Ninth graders examine rates, matrices, histograms, line graphs, data analysis and data presentation in order to develop an understanding of how these concepts apply to a the effects of a specific disease.
Curated OER
Journal of the Stars
Students receive balloons representing the "Life Cycle of the Stars." As the attached script is read, students follow the directions for the color of balloon they are given. Students chart the results for their star. They plot data from...
Curated OER
Water Usage and Conservation
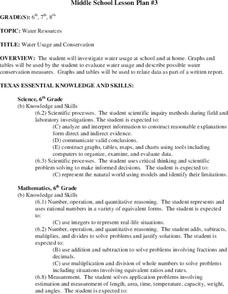
Pupils investigate water usage at school and at home. They use graphs and tables to evaluate water usage. Students describe possible water conservation measures. They use graphs and tables to relate data as part of a written report.
Curated OER
Believe It...Or Not
Pupils critically analyze data regarding climate changes using a glossary of terms generated by examination of climate related articles. They examine and graph climatic data, and discuss, hypothesize and test apparent discrepancies in...
Curated OER
Water - Planning for the Future
Students explore and examine the increases and/or decreases for water user groups: irrigation, municipal, manufacturing, steam electric power generation cooling, livestock, and mining. They utilize percentage changes during their...


