Curated OER
Pet Rocks
Students complete a variety of activities related to the physical characteristics of minerals. They classify and group candy, classify rocks and complete a Pet River Rock worksheet. Students try to guess which rock goes with each...
Curated OER
Healthy Eaters
Learners classify foods as "healthy" or "unhealthy" and sort foods into appropriate food groups. In this nutrition/physical education instructional activity, students play a game in which throwing skills are practiced. Pictures of food...
Curated OER
Math: Graphs and Their Symbols
Second graders examine different types of graphs and discover the meanings of the symbols used on them. After gathering data about themselves, their communities, and the world, they use that information to create graphs. Among the...
Curated OER
Potato chip Classification
Students create a dichotomous key using potato chips. In this classification lesson, students sort potato chips into groups based on observable characteristics. They record their results to create a dichotomous key in preparation for...
Curated OER
Probability Using M&M's
Students estimate and then count the number of each color of M&M's in their bag. In this mathematics lesson, students find the experimental probability of selecting each color from the bag. Students create pictographs and bar graphs...
Curated OER
The Jellybeans and the Big Dance
Enchant your youngsters by reading them The Jellybeans and the Big Dance, by Laura Numeroff and Nate Evans. Ask them to name objects that begin with the letter J like jellybeans. Give each of them some jellybeans to sort by color. They...
Primary Resources
Venn Diagrams
Combine your lessons on Venn diagrams, probability, and multiples with several activities. After picking seven cubes, learners note the number of cubes that are blue and mark them in a Venn diagram. The next assignments prompt them to do...
Curated OER
Conversation Hearts Graph: Valentine's Day
In this graphing conversation hearts worksheet, students sort and count the colors of candy hearts, and determine which color had the most and least numbers. Students answer eight questions.
Curated OER
The M&M's Brand Chocolate Candies Counting Book
First graders use estimation skills and gather data and record their findings
Curated OER
Skittle Graphing (Lesson Plan)
Students discuss the uses of graphs. They use color candies to count and sort before designing graphs. They label the graph papers with appropriate titles and candy colors. They complete the graph bars, and discuss the results with a...
Curated OER
M & M Counting Chart
Students create an individual M&M's graph based on the number of each color of candy pieces in their handful of candy. They graph the favorite color of the whole class while practicing counting and color identification.
Curated OER
Junk Food Math
Students use Skittles candies as they explore estimation and percentages. In this math lesson plan, students sort, count, and chart Skittles candies to learn about estimation and study percentages.
Curated OER
Smarties Investigation
In this math instructional activity, students participate in an investigation of Smarties candy. For example, students estimate how many candies they have in each color, count the actual number, and record the information in a tally chart.
Curated OER
The Statistics of M&Ms
Students explore the topic of statistics with M and Ms. In this math lesson plan, students use candy pieces to sort and gather information needed to create a bar graph. This instructional activity can be adapted to accommodate students...
Curated OER
Dynamite Data
Second graders rotate through a variety of stations designed to offer practice in manipulating data. They sort, tally and count items and then create bar graphs, tables, and pie graphs to record their findings.
Curated OER
100th Day Graphing
In this counting worksheet, students will use jellybeans or M&Ms for graphing the different colors. Students will sort the candies by color and count how many they have of each.
Curated OER
Taste the Rainbow
Students practice estimating and graphing by utilizing Skittles. In this statistics lesson, students complete worksheets based on the likelihood of a certain color of skittle coming out of the bag. Students create a graph based on the...
Curated OER
The Color of M and M's
In this math worksheet, students sort out the colors of candies. Then they count each color and create a flowchart. Finally they create a ratio for each color in comparison to the total number of candies.
Curated OER
Fishing For Fun
Second graders categorize fish crackers into groups by color and compare the two groups using the symbols <, =, and >. They use concrete objects to solve number sentences with equalities and inequalities.
Curated OER
Flavorful Spreadsheets
Students create a spreadsheet which includes a bar graph. They sort and classify information and use the average function on a spreadsheet. They research Skittles candy and summarize their findings on a spreadsheet.
Curated OER
Put Your Heart Into It
First graders sort Valentine candies according to kind. Data is inserted into a spreadsheet and displayed in various graphic formats.
Curated OER
M & M Fractions
Students explore the concept of fractions using M & M candies as a manipulative. They sort the candies, and write the correct fraction for each color of M & M's.
Curated OER
Sweet or Sour, Like or Different
Students watch a video on comparisons and discuss ways in which objects can be sorted. They play an identification game with a lemon and discuss identification characteristics.
Sylvandell Publishing
It's So Odd!
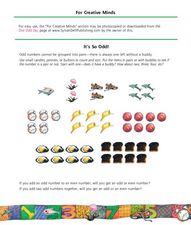
Some resources are just wonderful for stimulating creative thinking and concept understanding. Children are encouraged to explore odd and even numbers through a variety of creative activities. They group items, read a story, make an...
Other popular searches
- Candy Sorting
- Candy Sorting and Graphing
- Candy Sorting Kindergarten
- Candy Sorting K
- Candy Sorting 1st


