Statistics Education Web
The United States of Obesity
Mississippi has both the highest obesity and poverty rate in the US. Does the rest of the data show a correlation between the poverty and obesity rate in a state? Learners tackle this question as they practice their skills of regression....
EngageNY
Describing the Center of a Distribution Using the Median
Find the point that splits the data. The lesson presents to scholars the definition of the median through a teacher-led discussion. The pupils use data lists and dot plots to determine the median in sets with even and odd number of data...
Curated OER
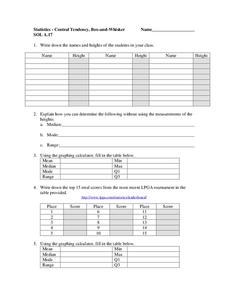
Central Tendency
In this central tendency worksheet, students solve and complete 10 different problems that include measures of central tendency. First, they write down the names and heights of students in their class. Then, students explain how they can...
Curated OER
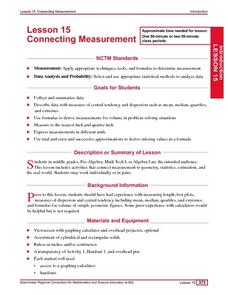
Connecting Measurement
Students participate in activities the connect measurement to geometry, statistics, estimation, and the real world. They collect measurements from their elbow to the tip of their middle finger and make a box plot of the data as well as...
American Statistical Association
How Fast Are You?
Quick! Snap up the lesson. Scholars first use an online app to collect data on reaction times by clicking a button when the color of a box changes. They then plot and analyze the data by considering measures of center, measures of...
EduGAINs
Data Management
Using a carousel activity, class members gain an understanding of the idea of inferences by using pictures then connecting them to mathematics. Groups discuss their individual problems prior to sharing them with the entire class. The...
Curated OER
Histograms and Frequency Tables
In this statistics worksheet, students solve and analyze graphs. They use histograms and frequency tables to solve their problems. There are 2 multiple choice questions with an answer key.
Curated OER
Statistical Analysis of Data by Gender
Students examine and identify gender bias, stereotyping, and discrimination in school materials, activities, and classroom instruction. They apply descriptive statistics knowledge to real-world data.
Illustrative Mathematics
Speed Trap
In which direction is traffic moving faster, north or south? Use box and whisker plots to organize data and interpret the results. Detailed solutions are included. This activity would be good as a warm up or quick assessment at the end...
Curated OER
Algebra: Do You See What I See?
Students discover how to find the mean, median, and mode from sets of data. By using statistical techniques such as whisker plots and bar graphs, they display the data gleaned from problems. Individually, students complete projects...
Curated OER
Breakfast Cereal - How Nutritious Is Yours?
Students analyze the nutritional value of breakfast cereal in order to make an informed choice. They create a stem and leaf plot which analyzes the nutritional value of the cereal they eat on a regular basis. Students write a letter to...
Statistics Education Web
10,000 Steps?
Conduct an experiment to determine the accuracy of pedometers versus pedometer apps. Class members collect data from each device, analyze the data using a hypothesis test, and determine if there is a significant difference between the...
Statistics Education Web
Double Stuffed?
True or false — Double Stuf Oreos always contain twice as much cream as regular Oreos. Scholars first measure the masses of the filling in regular Oreos and Double Stuf Oreos to generate a class set of data. They use hypothesis testing...
Rochester Institue of Technology
Ergonomic Design
To an engineer, the glass is never half full; it's just double the necessary size. The fifth installment of a nine-part technology and engineering series teaches pupils about the idea of ergonomic design. Measurements of popliteal height...
Mathalicious
On Your Mark
With many factors leading to a great athlete, does height make Usain Bolt unfairly fast? Middle schoolers conduct analysis to change the running distance of the Olympic races to be proportional to the height of the participants. They...
Curated OER
Mean and Median
Young scholars identify the different central tendencies. In this probability lesson, students create the correct type of graphs to analyze their data. They make predictions and draw conclusions from their data.
Curated OER
Visual Representation of Reduced Fat
Students demonstrate their understanding of the Five-Number Summary and Box-Plots by analyzing different nutrition labels from regular and reduced fat items using graphing calculators.
Curated OER
Stats on Reduced-Fat
Students demonstrate an understanding of the Five-Number Summary and Box-Plots after analyzing data from nutrition labels, forming a hypothesis and supporting it. They decide if there is a significant difference between reduced fat and...
Curated OER
Practice: Word Problems
Congratulations, you've just hit the word problem jackpot! Covering an incredible range of topics from integers and fractions, to percents, geometry, and much more, this collection of worksheets will keep young mathematicians busy...
National Council of Teachers of Mathematics
Eruptions: Old Faithful Geyser
How long do we have to wait? Given several days of times between eruptions of Old Faithful, learners create a graphical representation for two days. Groups combine their data to determine an appropriate wait time between eruptions.
Georgia Department of Education
The Basketball Star
Have learners use math to prove they are sports stars! Assess a pupil's ability to create and analyze data using a variety of graphs. The class will be motivated by the association of math and basketball data.
Texas Instruments
Measure Up!
Statisticians take things to new heights using a set of height measurements. Students use TI-82 or TI-83 calculators to determine extreme values and the median for the data. They also construct a box-and-whisker plot to summarize the...
Curated OER
Inequalities and Measures of Central Tendency
In this inequality and measures of central tendency worksheet, students solve and graph linear inequalities. They organize given data to identify the mean, mode and range. Students interpret box-and-whisker plots. This three-page...
Museum of Tolerance
Why is This True?
Are wages based on race? On gender? Class members research wages for workers according to race and gender, create graphs and charts of their data, and compute differences by percentages. They then share their findings with adults and...


