Curated OER
Probability and Statistics - Week 10
For this probability and statistics worksheet, students find compound dependent and independent probability of given situations. They identify the mean, mode, range and median of sets. This two-page worksheet contains explanations,...
Curated OER
Survey: What Shape Has More In the Lucky Charms Box?
In this Lucky Charms worksheet, students identify the shapes in the box, and using tally marks, count how many of each shape are included. This worksheet may be used in elementary grades, for counting and tally purposes, but it also can...
Curated OER
Fall Leaves
For this fall leaves worksheet, learners identify the colors of leaves and determine the number they have of each. This worksheet may be used in elementary grades, for color identification and counting purposes. For the middle school...
Curated OER
Inequalities and Measures of Central Tendency
In this inequality and measures of central tendency worksheet, students solve and graph linear inequalities. They organize given data to identify the mean, mode and range. Students interpret box-and-whisker plots. This three-page...
Curated OER
"M&M's"® Candies Worksheet 2
In this math worksheet, students plot the mean, median, and mode for the colors of M and M candies by filling in the graphic organizer.
Curated OER
Challenge: Agenian Ages-Statistics
In this statistics/data worksheet, learners use given statistics of people from a fictional planet to answer 6 related questions.
Curated OER
Statistics: Final Exam Review
For this statistics and probability worksheet, students are provided with a review of the final exam in statistics. The three page worksheet contains a combination of six multiple choice and free response questions. Answers...
Curated OER
Lesson #46: Bar Graphs and Line Graphs
For this bar graphs and line graphs worksheet, students interpret bar graphs, line graphs, and box-and-whisker plots. They find the measures of central tendency. This three-page worksheet contains notes, vocabulary, and...
Curated OER
Fruit Loops/Cheerios Activity: Measures of Central Tendency
In this measures of central tendency activity, students use Fruit Loops and Cheerios to gather statistical data. They find the mean, mode and median of the data. Students construct a box-and-whisker plot of the class data. This...
Curated OER
Central Tendency
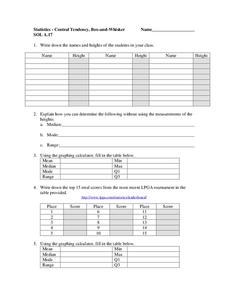
In this central tendency learning exercise, students solve and complete 10 different problems that include measures of central tendency. First, they write down the names and heights of students in their class. Then, students explain how...
Curated OER
Handling Data- Health Statistics
In this social studies worksheet, students organize 50 country cards into groups. Students analyze a chart and group countries according to lowest, middle, and highest Infant Mortality Rate.
Curated OER
High School Mathematics Problems from Alaska: Fire Fighting Crew
Students apply mean, median and mode calculations of firefighter test scores to decide on hiring.
Curated OER
"M&Ms"® Candies Worksheet 1
In this math worksheet, students find the likelihood of different outcomes with the use of M and M's candy for the seven questions and fill in the graphic organizer.
Curated OER
Family Activity: Bar Graphs and Line Graphs
For this math worksheet, students work at home with a family member on a graphing activity. Students count the number of cans, glass jars, boxes and bags in the pantry. Students make a bar and a line graph to represent the data.
Curated OER
Eight Integers and Eight Cubes
In this number puzzle worksheet, students are given 8 clues to find 8 integers. Clues refer to measures of central tendencies, abundant numbers, perfect cubes, and palindromes.
Primary Resources
Primary Resources: Mean, Median, Mode, and Range
Here are some teacher resources to aid in teaching mean, median, mode and range. Includes worksheets, games, and PowerPoint presentations.
Math Drills
Math Drills: Statistics and Probability Worksheets
Download these free worksheets to sharpen your skills with statistics and probability. Sheets focus on collecting and organizing data, measures of central tendency (mean, median, mode, and range), and probability.
Math Slice
Math Slice: Statistics: Math Worksheets
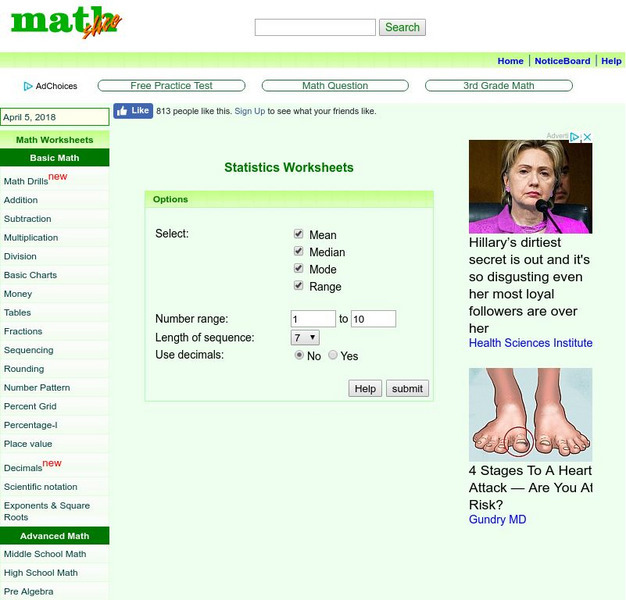
This tool allows you to create worksheets where students calculate the mean, median, mode or range of a set of numbers.


