Curated OER
Getting to Know You
Students create survey questions for their classmates. In this survey lesson, students pick a yes or no question and find what fraction of the class responded yes. They discover how the wording of a survey question can affect the answer.
Alabama Learning Exchange
What's Your Favorite Chocolate Bar?
Learners complete a math survey. In this math graphs lesson, students complete a survey about their favorite candy bars. Learners create different kinds of graphs using Microsoft Excel to show their results.
Curated OER
Carroll Diagrams
In this survey instructional activity, students view a survey of students who can swim and ride a bike and solve problems based on the survey. Students solve 4 problems.
Curated OER
Eye Color
Young scholars take a survey on eye color and plot their findings into a graph. In this eye color lesson plan, students take a class survey of everyone's eye color and learn how to put those findings into a graph.
Curated OER
Our Favorites
Students participate in and conduct a survey to determine various class favorites. They collect, organize and display their data, interpret the results, and complete a packet of worksheets to display the information.
Curated OER
Money Circulation: A Story of Trade and Commerce
Middle schoolers are introduced to the meaning, symbolism, and value of the quarter. They determine the percentage of total monetary value held in quarters and graph the results. Students infer about the U.S. Mint's distrubution of...
Curated OER
The Human Line Plot
Fifth graders collect data and use charts and line plots to graph data. Through class surveys, 5th graders collect data concerning a particular subject. They graph their data using a line graph. Students make inferences and predictions...
Curated OER
Favorite Pets
In this tally chart worksheet, students finish filling in a chart involving a survey of favorite pets from a particular class. Students then answer 4 short answer questions about the results of the survey.
Curated OER
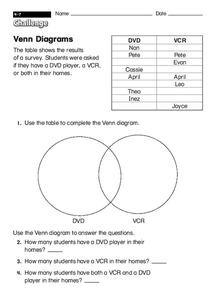
Venn Diagrams
In this Venn diagram worksheet, students insert the answers of a survey about electronics into a Venn diagram. Students complete the diagram and then answer 3 short answer questions.
Curated OER
How Green Are You?
In this environment worksheet, students take a survey, write about being green, fill in the blanks to sentences, and more. Students complete 7 activities.
Curated OER
Level 2 Fraction Sets
In this mathematics worksheet, students solve various word problems by selecting the correct fraction for each response. There are eight problems to solve on the sheet.
Curated OER
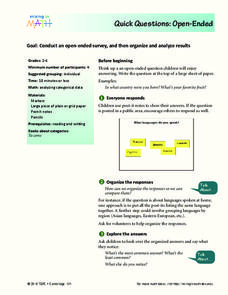
Quick Questions: Open-Ended
Pupils conduct an open ended survey and analyze the data they found. In this open-ended survey lesson plan, students ask others their open ended questions and then organize their results based on the most common, least common, and every...
Curated OER
A Measure of Happiness
Students share opinions about the factors that contribute to or detract from their happiness. They create survey to determine how people in their community measure happiness, and write reflections on the relationship between money and...
Curated OER
Data From Interviews
Students create and conduct a survey about favorite foods, gather and represent the data, interpret data and make predictions to present to the class. They create and use interview questions to gather data. Pupils are explained that...
Curated OER
Pie Charts
The teacher conducts a survey of each student's favorite color. The teacher then creates a pie chart identifying the information gathered. The students display mastery by creating their own pie chart displaying the same information.
Curated OER
Career Choices
Students work in groups to brainstorm ideas about different jobs they could have in the future. In this careers lesson plan, students learn about careers, brainstorm what they could do, take a survey, and differentiate between...
Curated OER
Coping With Violence
Learners conduct surveys to see how the media influences their lives. In this media lesson plan, students make art projects that reflect their reactions to current conflicts and violence that is spread through the media.
Curated OER
It's Not Easy Being Green
Pupils complete a unit that focuses on their school's waste production. They conduct a litter survey, collect the waste produced in their classroom for a week and generate a waste-audit, and identify how their school can minimize waste...
Curated OER
Our Opinions
In this opinion survey instructional activity, students will work in groups of four to complete a survey of each group member's opinion on 20 topics.
Curated OER
Categorizing Data and Bias
In this categorizing data and bias worksheet, 9th graders solve 10 different problems that include various types of qualitative or quantitative data. First, they determine if the problem stated is univariate or bivariate data. Then,...
Curated OER
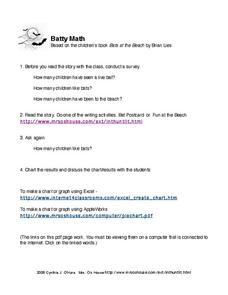
Batty Math
In this bats instructional activity, learners click on the link to read a story about bats and then answer short answer questions, take a survey, and create graphs about it. Students complete 4 tasks total.
Curated OER
Computer Graphing
Students research the Internet or create surveys to find graphable data. They collect, organize, analyze and interpret the data. Finally, they choose the appropriate type of graph to display the data and find the measures of central...
Curated OER
The Effects of Counseling on The Potential Drop-out
Tenth graders analyze information from students who have left school before graduation, and utilize the information as a strategy designated to lower the drop-out rate of the at-risk students. They design a rubric, create a web page, and...
Curated OER
Tasty Tech Activity With Excel
Learners are introduce to basic Excel skills, rank their opinions of menu items from fast food restaurants, add their answers to the spreadsheet, and then create a simple graph of the results.
Other popular searches
- Elementary Student Survey
- Holiday Student Survey
- High School Student Survey
- Create Student Survey
- Student Survey Form
- Student Survey on Math
- Student Survey of Teacher
- Student Survey on Economics
- Bully Student Survey
- Student Survey Media
- Student Survey Health
- Student Survey on Health


