Los Angeles County Office of Education
Assessment For The California Mathematics Standards Grade 6
Test your scholars' knowledge of a multitude of concepts with an assessment aligned to the California math standards. Using the exam, class members show what they know about the four operations, positive and negative numbers, statistics...
Mathematics Assessment Project
A Day Out
An applicable task presents a problem for pupils to solve: where to go for a class field trip. The pupils must take into consideration the first and second choices of members of the class when determining where to go. Individuals also...
Seussville
Hooray For Diffendoofer Day!
Eleven engaging activities make up a story guide that accompanies Dr. Seuss' Hooray For Diffendoofer Day! Scholars design a fictional classroom setting including scary face tests, writing job descriptions, adapting the book into a play,...
US Department of Commerce
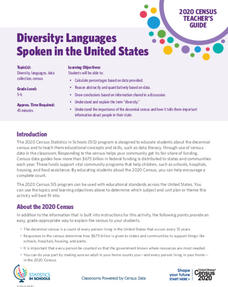
Diversity: Languages Spoken in the United States
High schoolers begin a discussion on diversity and determine the percent of the population that speak another language at home in the US. Classmates make a prediction of the percentage of people that speak another language at home in...
US Department of Commerce
Where to Next?
Salary, education, census statistics ... how do people choose their careers? Scholars complete worksheets and rely on census data to determine their career aspirations. Then, pupils conduct Internet research about places they would...
US Department of Commerce
How Are Single-Parent Households Distributed Across the United States?
There sure are a lot of single-parent households in the country. After selecting one of four US regions to investigate, pupils create dot plots and box plots on the percentage of single-parent households with male parents and female...
US Department of Commerce
Learning About College Degrees and Lifetime Earnings
It's never too early to start thinking about college majors. Using census data, scholars research the lifetime earnings for two selected careers. They then write and solve word problems to compare the amounts. To add a visual component,...
US Department of Commerce
Featured Activity: Let’s Get the Count Right
Don't leave anyone out. To highlight the importance of the US Census to younger learners, an activity has them distribute markers to see if there are enough for each person. They see that counting the population is necessary to fairly...
US Department of Commerce
Let's Count!
Counting objects is easy as one, two, three. Young mathematicians count objects in the classroom and create data tables to record their results. They then write comparison statements and answer questions about the data.
US Department of Commerce
Immigration Nation
People come and people go. Given tabular census data on the annual number of immigrants from four different regions of the world between 2000 and 2010, pupils create double bar graphs and line graphs from the data. They analyze their...
US Department of Commerce
Exploring Sampling Variability - Higher Education Attainment Across The United States
More education in statistics is always beneficial. Given cards that provide the proportion of adults with bachelor's degrees in 10 random US states, scholars individually determine the sample percentage of states in which more than 30...
US Department of Commerce
Educational Attainment and Marriage Age - Testing a Correlation Coefficient's Significance
Do women with college degrees get married later? Using a provided scatter plot of the percentage of women who earn bachelor's degrees and the median age at which women first get married over time, pupils conduct a linear regression...
US Department of Commerce
Over the Hill - Aging on a Normal Curve
Nobody is too old to learn something new. Young statisticians analyze census data on the percentage of the population older than 65 years old in US counties. They fit a normal distribution to the data, determine the mean and standard...
US Department of Commerce
Using Fractions to Compare Amusements Parks By States
Amuse learners with a lesson on amusement parks and fractions. Using provided census data on the number of amusement parks in each state, third graders represent the fraction of states that fall within a certain range. They create a...
US Department of Commerce
Comparing My State
How does your state compare? Using census data, scholars determine the total population and the number of 11-year-old boys and girls in two different states. They round and compare values, and then make up a question about the two states...
US Department of Commerce
The Place of My State
State the population of the state. Pupils research census data on the total population, the number of children their age, and the number of children of the same age and gender in their states. They write these numbers in standard,...
US Department of Commerce
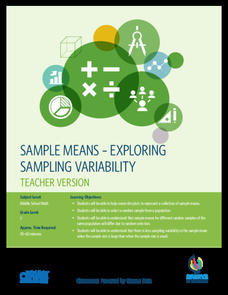
Sample Means - Exploring Sampling Variability
Sample an excellent resource on sampling variability. Pupils analyze census data on the percentage of homes in each state that have Internet access. They take random samples of different sample sizes, determine the sample means, and then...
US Department of Commerce
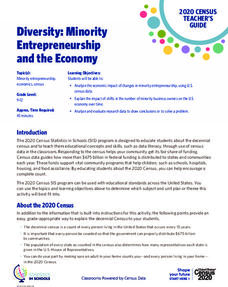
Diversity: Minority Entrepreneurship and the Economy
Using data from the Census Bureau, learners discover the growth in minority-owned businesses over time. After crunching numbers, analytical questions probe the reasons behind the shift.
US Department of Commerce
Featured Activity: Exploring Questions for the 2020 Census
Just what is the census for? Using data and census questions, class members explore how officials gather information. Then, they consider how the government uses the answers to determine how it spends its money with a collaborative...
Curated OER
Popcorn Math
Everyone loves popcorn! Use this treat to teach math concepts including place value, estimating, graphing, and volume. Eight possible activities are included, and they can be modified to fit all grade levels.
Curated OER
Design A Playground
Students engage in a lesson plan that is concerned with the concept of designing a dream playground. They conduct a survey of specific traits needed for the equipment. Students draw a picture of the ideal playground and then construct a...
Curated OER
First-Aid Day
The second Saturday of September is recognized annually as World First Aid Day. In this First Aid Day worksheet, learners read or listen to a passage, then match phrases, fill in the blanks, choose the correct word, unscramble words and...
Curated OER
Big Foot Bar Graph
Students explore all the different sizes of feet within their age range while exercising their graphing skills. They work in teams to survey children in their grade to gather data about the different range of shoe sizes. Each group then...
Curated OER
Columbus Day
Use this Columbus day learning exercise with your EL class. They will read or listen to a passage about Christopher Columbus, then match phrases, fill in the blanks, choose the correct words, unscramble words and sentences, put sentences...
Other popular searches
- Elementary Student Survey
- Holiday Student Survey
- High School Student Survey
- Create Student Survey
- Student Survey Form
- Student Survey on Math
- Student Survey of Teacher
- Student Survey on Economics
- Bully Student Survey
- Student Survey Media
- Student Survey Health
- Student Survey on Health


