Curated OER
Students Speak Up
Young scholars reflect on their use of technology for learning and communication both inside and outside of school. They consider how their math, science, and technology education is preparing them for future success. They discuss...
Curated OER
Math Skills-Writing Scientific Notation
In this scientific notation worksheet, students perform basic math functions and express their answers in scientific notation.
Curated OER
Boy Scout Merit Badge: Surveying
In this boy scout merit badge: surveying worksheet, 8th graders research the websites listed to answer 8 detailed questions about first aid, surveying projects, GPS, the impact of surveying and careers.
Curated OER
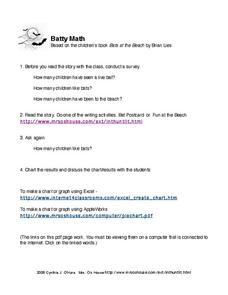
Batty Math
In this bats instructional activity, learners click on the link to read a story about bats and then answer short answer questions, take a survey, and create graphs about it. Students complete 4 tasks total.
Curated OER
Birthdays Survey and Tally List
In this birthday tallying learning exercise, students survey classmates and fill out a tally chart of what day every person's birthday is on. Students also make a tally chart about birthday months and years. This page is intended to be...
Curated OER
What Do You Like on Top of Your Pizza Most? --class Bar Graph
In this math worksheet, students participate in completing a bar graph as a class. Students survey classmates as to their favorite pizza toppings and plot the results on this bar graph.
Curated OER
Plotting Data on a Graph
Young scholars investigate graphing. For this graphing lesson, students survey the class and create graphs to reflect the data collected.
Curated OER
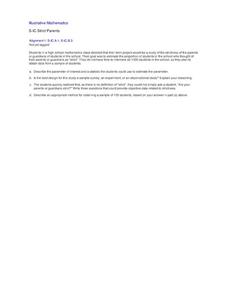
Strict Parents
Are your parents or guardians strict? That's an interesting question many of your pupils are probably interested in discussing. How do you design a study directed at your high schooler to gain insight into that question? How do you...
Curated OER
Asthma Survey
Learners collect survey data on the prevalence of asthma in a community. They summarize and display the survey data in ways that show meaning.
Curated OER
TV Survey - Data Collection and Analysis
In this data collection and analysis worksheet, 4th graders complete a tally chart about the number of hours that fourth graders watch television. They create a bar graph with the information, write a paragraph about the survey results,...
Curated OER
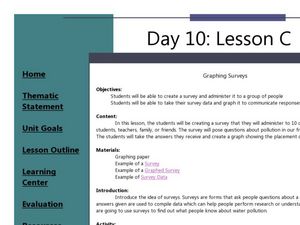
Graphing Surveys
Students collect data and graph it. In this algebra lesson, students create a survey for their classmates and teachers. They analyze the results from the survey and graph it. They draw conclusion from their data based on the graph.
Curated OER
Fire Safety Survey
Students collect data regarding fire safety and create a graph. Working in small groups, they administer a survey to family and friends regarding their attitudes toward fire safety. After data has been gathered, students graph their...
Curated OER
School Safety Survey Project
Students investigate safety issues at school. In this citizenship lesson, students discuss things they are fearful of at school. Students then conduct a school survey asking what others are fearful of.
Curated OER
Multiple Intelligences Survey
In this multiple intelligences worksheet, students complete a survey asking them about different ways they like to learn. Students complete 24 questions. This should be a very enjoyable activity for students.
Curated OER
Mayor Puts City on Diet to Lose a Million Pounds
Students read a story called Mayor Puts City on Diet to Lose a Million Pounds and answer vocabulary and comprehension questions about it. In this current event Lose a Million Pounds lesson plan, students respond to literature by...
Curated OER
Water on the Moon!
In this moon worksheet, students read about the data collected from the Deep Impact/EPOXI and Cassini missions to the moon that have detected the presence of hydroxyl molecules under the moon's polar craters. Students solve 4 problems...
Curated OER
Surveying and Graphing- Favorite Character in Charlotte's Web
In this math and literature worksheet, students survey classmates about their favorite character in Charlotte's Web and display the data on a bar graph. The blank graph is unlabeled; there are no lists of characters to choose from.
Curated OER
What Do You Like on Your Popcorn?-- Class Bar Graph
In this math worksheet, students participate in a class bar graph activity. Students survey classmates as to their popcorn preferences: nothing, butter or salt. Results are plotted on the graph.
Curated OER
Data Analysis Challenge
In this data analysis worksheet, young scholars work with a partner to collect information for a survey. The information is then compiled into a graph. Students must indicate their survey question, the target audience, predict the...
EngageNY
Evaluating Reports Based on Data from a Sample
Statistics can be manipulated to say what you want them to say. Teach your classes to be wise consumers and sort through the bias in those reports. Young statisticians study different statistical reports and analyze them for misleading...
Worksheet Place
How I Get to School
Find out how many of your learners take the bus, how many walk, and how many bike with a quick survey. Class members gather data about how each individual gets to school and mark the results on this page in order to create a bar graph.
Curated OER
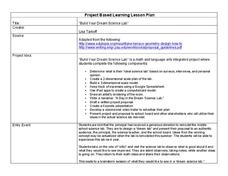
Build Your Dream Science Lab
Would your ideal science lab be filled with bubbling beakers and zapping Tesla coils? Or would it contain state-of-the-art computer technology and data analysis? Dream big with an innovative lesson that connects math and language arts...
Curated OER
Practice: Word Problems
Congratulations, you've just hit the word problem jackpot! Covering an incredible range of topics from integers and fractions, to percents, geometry, and much more, this collection of worksheets will keep young mathematicians busy...
Curated OER
All About Graphs
Students practice organizing data by creating graphs. In this statistics lesson, students survey the class about favorite colors and create a bar graph using the data. Students complete a test based on pet and animal statistics.


