Teach Engineering
Stormy Skies
Young meteorologists examine the four main types of weather fronts and how they appear on a weather map. Participants learn about the difference between the types of weather fronts along with their distinguishing features. A...
Curated OER
Weaving Weather Maps with the World Wide Web
Students access the Internet and use real time data from the American Meteorological Society to create a detailed weather map. They make weather predictions based on the data collected.
Curated OER
Reading Weather Maps
Fourth graders the symbols that are used on weather maps. They develop five day forecasts based on information they gather from weather maps in the newspaper and on the Internet.
PBS
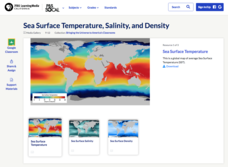
Sea Surface Temperature, Salinity, and Density
Earth's vast ocean is full of mysteries! Science scholars discover the big-picture properties that influence its characteristics at different latitudes using a activity from PBS's Weather and Climate series. After completing a background...
Curated OER
Regents High School Examination: Physical Setting Earth Science 2009
Junior geologists address 50 multiple choice questions and 35 short answer questions about the earth system. Plenty of visuals are included for interpretation: diagrams, graphs, maps, photographs, laboratory setups, weather symbols, and...
Curated OER
Learning Lesson: Analyzing a Weather Map
Young scholars use weather maps to locate warm and cold fronts. They discover the different types of weather associated with these fronts. They also observe the weather in their local area.
Curated OER
Surface Meteorological Observation System (SMOS)
Students investigate local surface weather conditions. They log weather conditions for thirty days, develop a graph, plot cloud cover, and compare/contrast the graphed lines of various weather factors.
Curated OER
Regents High School Examination: Physical Setting Earth Science 2010
Every topic under the sun is covered in this New York State Regents High School Examination. With the focus of earth science, participants answer 85 quesitons about the solar system, geologic time, rocks and minerals, landforms, and...
Center Science Education
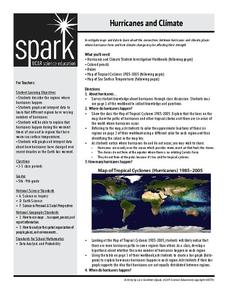
Hurricanes and Climate
Feeling under the weather? This lesson on hurricanes can whip things up! With professionally designed maps and handouts, teach your future weathermen (or women) where, when, and how hurricanes occur. They identify hurricane regions and...
Curated OER
Weather Predictions
Pupils record weather data and create a five day forecast. Students investigate the roles of meteorologists and identify symbols used on a weather map. After gathering weather data for a week, pupils will create a five day forecast based...
Curated OER
Interpreting Weather Station Symbols
For this science worksheet, students look at the symbols on the map and make interpretations about temperature or other conditions to master the weather knowledge in the four problems.
Curated OER
A Comparison of Cloud Coverage Over Africa
Students use a NASA satellite data to contrast amounts of cloud coverage over different climate regions in Africa. They explore how Earth's major air circulations affect global weather patterns, and relate to local weather patterns.
Curated OER
Settlement Exploration: Then and Now
NASA has crafted an imaginative and memorable series of lessons, "NASA and Jamestown Education Module." This lesson is one of the five components. In it, middle schoolers connect history and science by comparing the settlement of...
Curated OER
Creating Station Models
Students work in groups to interpret weather maps. They use latitude and longitude readings to complete a worksheet together and turn in the worksheet along with the maps and a rubric.
NASA
Cloudy vs. Clear - Graphs
Explore the link between solar energy and cloud cover using real data from NASA from China! Future climatologists analyze and interpret graphs of solar energy on clear and cloudy days using a literacy cube. Investigators draw conclusions...
Curated OER
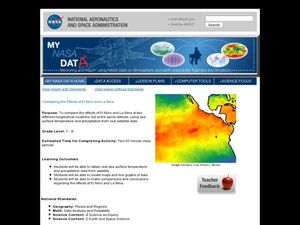
Comparing the Effects of El Nino and La Nina
Students examine the differences between an El Nino and La Nina year. In this investigative lesson students create maps and graphs of the data they obtained.
Curated OER
Is Portland, Oregon Experiencing Global Warming?
Students use data to determine if the climate in Portland has changed over the years. In this weather lesson students complete line graphs and study long wave radiation.
NOAA
Understanding El Niño Using Data in the Classroom
Are weather troubles caused by El Nino? An installment of a larger series presents a five-part lesson on El Nino. First, scholars learn to read sea surface temperature maps. Then, they compare them to data on graphs before determining if...
NASA
Hurricanes and Hot Towers with TRMM
Take cover because a wild presentation on hurricanes is about to make landfall in your classroom! An outstanding PowerPoint presentation is the centerpiece of this instructional activity. Not only does it provide information and...
Curated OER
Wind Circulation, Surface Currents and Climate
Students describe connections between wind patterns, surface currents, and ocean climate zones. In small groups, they color the ocean climate zones in four different shades of blue. Students then answer questions like what four...
Curated OER
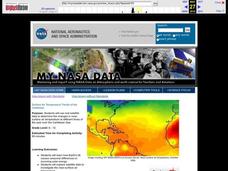
Surface Air Temperature Trends of the Caribbean
Students investigate the seasonal changes to sea surface and near-surface air temperatures near the equator. They use actual satellite data to track and graph the differences in air and sea temperatures during different seasons in the...
Polar Trec
Global Snow Cover Changes
Snow is actually translucent, reflecting light off its surface which creates its white appearance. Pairs or individuals access the given website and answer questions about snow cover. They analyze graphs and charts, examine data, and...
Curated OER
Tracking the Weather Using Technology
Fourth graders explore the use of technology to monitor and forecast weather. They investigate the different types of weather monitoring and forecast tools. Students interpret radar images and discuss the traditional types of weather...
Curated OER
Acid Rain
Students use real-time weather maps to determine the likelihood of acid rainfall in a region. Students apply their understanding of interaction between weather systems, land and air pollution, to address acid rain and the effects on...


