Curated OER
A Changing Planet
Young scholars describe climate change and the future impact it could have on our physical environment. They identify the regions of the world that would encounter the most significant effects of a global warming.
Curated OER
Sustainable Southern Belize: Coral Health Lesson Plan
Fifth graders investigate coral reefs and the dangers they face by labeling and drawing. In this oceanography lesson plan, 5th graders view a PowerPoint presentation of photographs of coral reefs in Belize. Students investigate and...
Curated OER
Solar Box Cooker
Students explore solar power. For this solar power lesson, students build simple solar cookers after they study convection, conduction, and radiation. Students transfer their knowledge of how the solar cooker works to climate changes on...
Curated OER
Leave No Trace
Students explore what is needed, when preparing for an outdoor trip. In this leave no trace lesson, students examine the equipment required for a camping trip, discuss the hierarchy of needs, and review the seven principles of leave no...
Curated OER
Trouble in the Troposphere
Students create graphs using NASA data, compare ozone levels of several U.S. cities, analyze and evaluate the data and predict trends based on the data, and discuss and describe how human activities have modified Earth's air quality.
Curated OER
Does Humidity Affect Cloud Formation?
Young scholars use NASA's S'COOL database to identify factors that affect cloud formation.
Curated OER
Ojala que viajemos a Mexico!
Students research the names and locations of Spanish speaking countries throughout the world. They use a world map to become familiar with the locations of these countries and use the Internet to conduct further research. They sing...
Curated OER
Exploring Rocks
Students recognize differences in the size, shape, texture, and color of different rocks. In this rocks lesson plan, students also learn and repeat back how a volcano erupts and make one out of a toilet paper tube.
Curated OER
Rainy Day Hike
Students develop awareness about the water cycles. They identify the watershed in which their school is located. They explain the role the schoolyard plays in the watershed.
Curated OER
Introduction to the Barnegat Bay Estuary
Students research estuaries. In this estuaries lesson, students discuss the differences in a bay and an ocean. Students watch a PowerPoint of the properties of the estuaries and geography of Barnegat Bay. Students complete a worksheet...
Curated OER
Using My Nasa Data To Determine Volcanic Activity
Students use NASA satellite data of optical depth as a tool to determine volcanic activity on Reunion Island during 2000-2001. They access the data and utilize Excel to create a graph that has optical depth as a function of time for the...
Curated OER
Science: Trouble in the Troposphere
Students research a NASA Website and record information about an assigned city's tropospheric ozone residual monthly climate. In groups, they graph the information for the past year. They form new groups and compare their city's...
University of Wisconsin
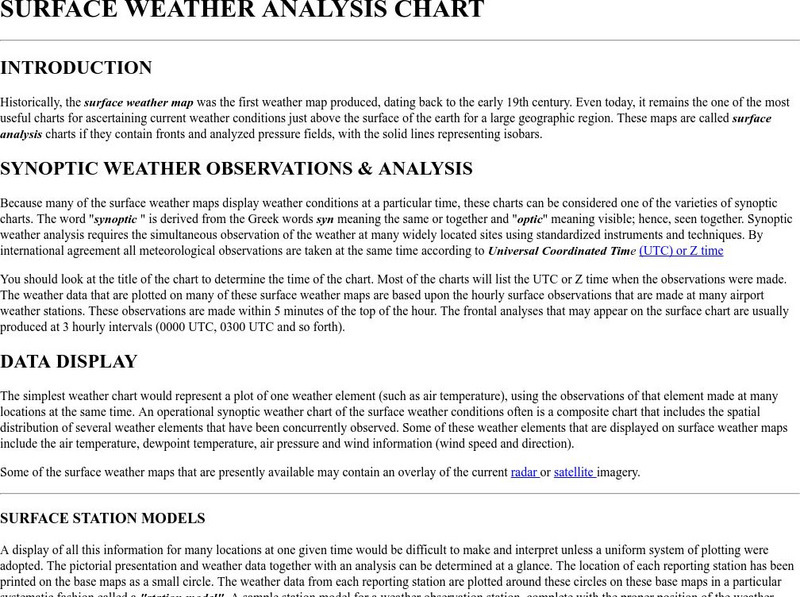
Atmospheric and Oceanic Sciences: Surface Weather Analysis
Explains the use of synoptic weather analysis in preparing weather maps and forecasting. Discusses the use of symbols as well.
NASA
Nasa Earth Observatory: Global Maps: Land Surface Temperature
View a global map from NASA's Earth Observatory that shows land surface temperature from February 2000 to November 2008. Learn how land surface temperature is measured and monitored.
TeachEngineering
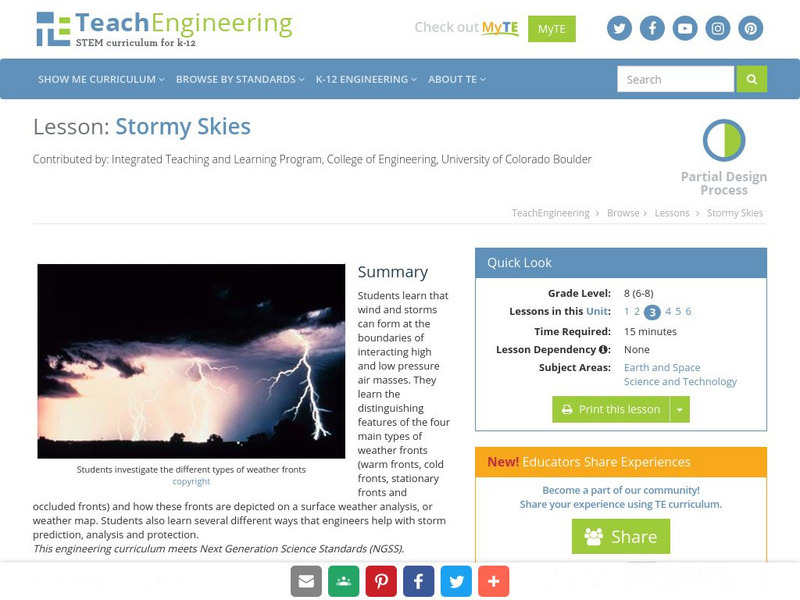
Teach Engineering: Stormy Skies
Students learn that wind and storms can form at the boundaries of interacting high and low pressure air masses. They learn the distinguishing features of the four main types of weather fronts (warm fronts, cold fronts, stationary fronts...
NASA
Nasa Earth Observatory: Global Maps: Sea Surface Temperature
This global map from NASA's Earth Observatory shows the sea surface temperature from July 2002 to October 2008. Learn the influences that sea surface temperature has on climate and weather.
National Weather Service
National Weather Service:climate Prediction Center: Daily Precipitation Analysis
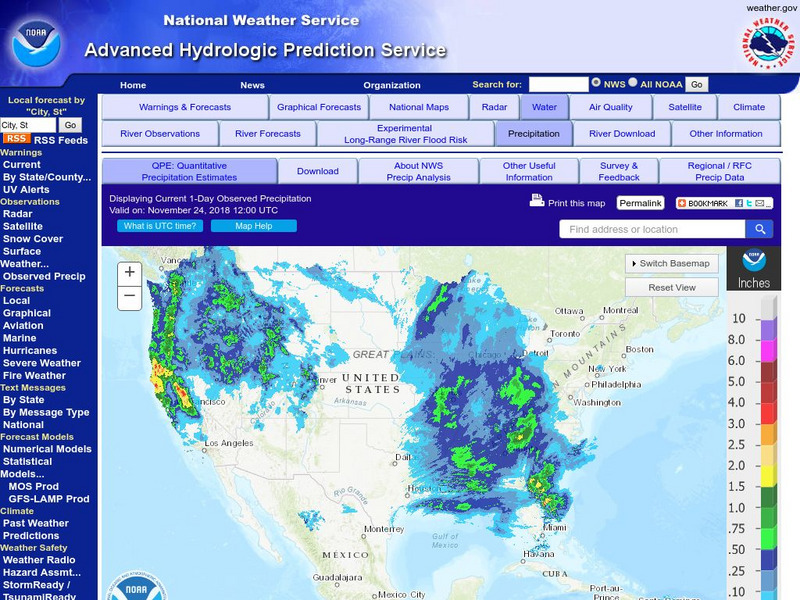
Find real-time daily precipitation analysis for the United States, Mexico, and South America as well as accumulated precipitation maps for the past 30 or 90 days.
Dan Satterfield
Dan's Wild Weather Page: Forecasting
Find out about the art and science of forecasting at this site from Dan's Wild Weather Page.
ClassFlow
Class Flow: Tornados in the Us
[Free Registration/Login Required] Overview: In this lesson, students will learn the basics about how tornadoes are formed, and when and where they are most likely to occur. They will learn that the United States is the country most...
University of California
Earthguide: El Nino: Illustrating the Concept
Do you know what happens during a typical El Nino? This overview provides a description, characteristics, and animated maps showing sea surface temperature changes during past El Nino events.


