Illustrative Mathematics
Ratio of Boys to Girls
How many boys are in the class? Here is an introductory exercise describing ratios. The commentary shows different ways learners can approach the problem, using a tape diagram of boys to girls and using a table. The activity includes...
University of Utah
Integer Exponents, Scientific Notation and Volume
A one-stop resource for exponents, square and cube roots, scientific notation, and volume formulas guides learners through properties of exponents. As they learn to apply these properties to operations with scientific notation,...
Curated OER
Molas
Seventh graders apply their prior knowledge of the Principle of Balance to create a paper mola. Students examine a variety of molas, which are fabric works of art made by women in the country of Panama. To arrange the composition of the...
EngageNY
Congruence, Proof, and Constructions
This amazingly extensive unit covers a wealth of geometric ground, ranging from constructions to angle properties, triangle theorems, rigid transformations, and fundamentals of formal proofs. Each of the almost-forty lessons...
EngageNY
Summarizing a Data Distribution by Describing Center, Variability, and Shape
Put those numbers to work by completing a statistical study! Pupils finish the last two steps in a statistical study by summarizing data with displays and numerical summaries. Individuals use the summaries to answer the statistical...
EngageNY
Using a Curve to Model a Data Distribution
Show scholars the importance of recognizing a normal curve within a set of data. Learners analyze normal curves and calculate mean and standard deviation.
Curated OER
Number and Operations- Using Gift Certificates
Students apply number and operation skills to learn how to spend a gift certificate. In this mathematical reasoning lesson, students use base 10 blocks as money and calculate how much money they have.
Curated OER
Application of Graph Theory
Students investigate different online tutorials as they study graphing. In this graphing lesson, students apply the concept of graphs cross curricular and use it to make predictions. They define the purpose and theories behind graphs.
Illustrative Mathematics
Running at a Constant Speed
The learner must use the given constant speed to find the unit rate. A table is made in order to relate the speed to the time and the distance. From the table, learners are able to see the unit rate in miles per minute and miles per...
Curated OER
Data Analysis, Probability, and Discrete Mathematics: Lesson 4
Eighth graders investigate the concepts of probability while performing data analysis. They apply statistical methods in order to measure or predict some possible outcomes. The information is collected and graphed, 8th graders analyze...
Curated OER
Guess and Test/Make a Table
Students explore problem solving strategies. In this middle school mathematics lesson plan, students investigate the guess and test and make a table problem solving strategies. Students work in pairs to apply the problem...
Curated OER
Apply Scientific Inquiry and Scientific Habits of Mind
Students review the components of the scientific inquiry method. In groups, they apply this method to various experiments they are given to complete. They also use the correct scientific habits of mind when researching different concepts.
EngageNY
Polynomial, Rational, and Radical Relationships
This assessment pair goes way beyond simple graphing, factoring and solving polynomial equations, really forcing learners to investigate the math ideas behind the calculations. Short and to-the-point questions build on one another,...
EngageNY
Multiplying and Factoring Polynomial Expressions (part 2)
If you can multiply binomials, you can factor trinomials! This is the premise for a lesson on factoring. Pupils look for patterns in the binomials they multiply and apply them in reverse. Examples include leading coefficients of one...
EngageNY
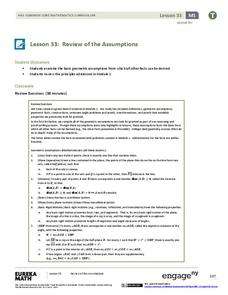
Review of the Assumptions (part 1)
What was the property again? Tired of hearing this from your pupils? Use this table to organize properties studied and as a reference tool for individuals. Learners apply each property in the third column of the table to ensure their...
Indian Institute of Technology
Could King Kong Exist?
The title says it all: Could King Kong exist? Investigate how increasing the dimensions of an object affects its surface area and volume to mathematically conclude whether a creature with the weight and height of King Kong could actually...
EngageNY
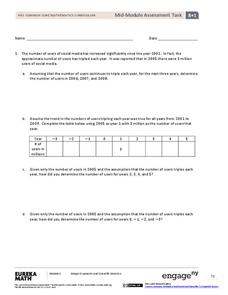
Mid-Module Assessment Task: Grade 8 Module 1
Assess your young mathematicians' knowledge and understanding of the properties of exponents. The questions in the seventh lesson of 15 incorporate the properties learned in the first six modules of this series. Individuals use and apply...
EngageNY
Why Call It Tangent?
Discover the relationship between tangent lines and the tangent function. Class members develop the idea of the tangent function using the unit circle. They create tables of values and explore the domain, range, and end behavior of...
EngageNY
Connecting Graphical Representations and Numerical Summaries
Which graph belongs to which summary statistics? Class members build upon their knowledge of data displays and numerical summaries to connect the two. Pupils make connections between different graphical displays of the same data in...
EngageNY
Correspondence and Transformations
Looking for a strategy to organize the information related to transformations? The materials ask pupils to identify a sequence of rigid transformations, identify corresponding angles and sides, and write a congruence statement. They...
EngageNY
Understanding Box Plots
Scholars apply the concepts of box plots and dot plots to summarize and describe data distributions. They use the data displays to compare sets of data and determine numerical summaries.
NASA
Connecting Models and Critical Questions
Scholars use data to analyze and determine which sets of information need to be counted. They create a model to explain differences among chemical elements using graphs to prove concept mastery.
National Security Agency
Growing Patterns: Practical Pattern Problems
Your learners explore growing patterns by describing, extending, creating, and evaluating practical pattern problems in this three-day collaborative unit. Beginning with concrete patterns and function tables to extend and...
Curated OER
Monster Data
An inventive lesson shows learners how to collect, organize, and present mathematical data. They access websites which lead them through a variety of ways to engage in data collection. They get to design and create graphs, and present...


