Curated OER
Population Biology
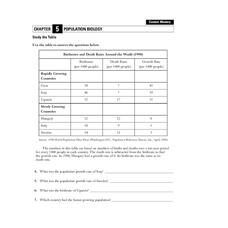
In this population instructional activity, students will use a table with information about the birth rates and death rates from different countries around the world to complete 4 short answer questions.
Curated OER
Probabilities for Number Cubes
Learners explore the concept of probability. In this probability lesson, students roll a six-sided number cube and record the frequency of each outcome. Learners graph their data using a frequency chart and keep tally marks in a...
Curated OER
Catch, Tag, and Release
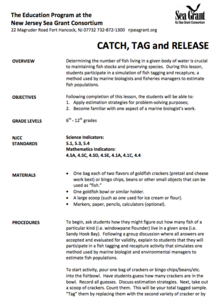
Learners discover how fish tagging is used by marine biologists and fisheries to estimate fish populations. Participating in a simulation, learners use estimation to determine the whole population from a small number of items.
Curated OER
Science Safety is Elementary
Third graders are introduced to the importance of science safety. As a class, they role play through different safety procedures and decide which senses need to be protected for different scenerios. They discuss how to avoid hazardous...
Curated OER
Writing Ionic Formulas
In this ions worksheet, students use a table of common ions to determine how to write the chemical formula, using subscripts, to make a neutral compound. This worksheet has 44 problems to solve.
Curated OER
Arthropod Life Cycle
In this arthropod life cycle worksheet, students will use a diagram showing the 4 stages of butterfly metamorphosis to complete a table describing each of the stages.
Curated OER
Pigs, Pigs, Pigs!
Third graders find information about different breeds of pigs using the Internet, books, and encyclopedias. Groups select one breed of pig that interests them. They construct a stuffed likeness of the pig.
Curated OER
Graphing the Forecast-Line Graph or Bar Graph?
Learners explore bar and line graphs. In this data collection, graphing, and weather lesson, students compare bar and line graphs and discuss which type of graph would be most appropriate for displaying a ten day weather forecast....
Curated OER
Math in Science-Radioactive Decay and Half-Life
In this radioactive decay and half-life worksheet, learners use given half-lifes to calculate the amount of time it will take for certain amounts of elements to decay. They also find the age of samples and determine how many grams of...
Curated OER
Earthquake Power
In this earthquakes worksheet, students learn about the measurements of earthquakes on the Richter scale. They answer six questions about the magnitudes and sizes of earthquakes using two tables of data about earthquakes and the Richter...
Curated OER
Connections to Fine Art: What Happens in a Kiln?
In this kiln worksheet, students read about how temperature effects the results of fired pottery. They answer questions using the information and data given.
Curated OER
Mixed Review
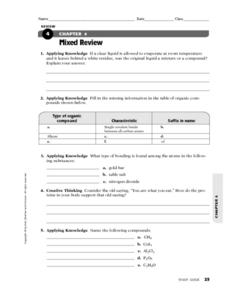
In this chemistry worksheet, students solve chemical equations and define terminology using previous knowledge. There are 8 review questions.
Curated OER
Comparing Data
Eighth graders create a survey, gather data and describe the data using measures of central tendency (mean, median and mode) and spread (range, quartiles, and interquartile range). Students use these measures to interpret, compare and...
Curated OER
Groundwater
In this groundwater activity, students use 12 given terms and match them to their definitions related to characteristics of groundwater and the components of the ground where the water travels. Students also fill in 5 blanks with given...
Scholastic
Make a Mini Mayflower
Students discover the importance and history behind the Thanksgiving feast. Using walnut shells and toothpicks, they construct models of the Mayflower and simulate giving them to the Native Americans for helping the Pilgrims survive.
Curated OER
Making a Line Graph
In this line graph worksheet, students use data given in a table and assign axes, make a scale, plot data and make a line or curve on their constructed graphs.
Curated OER
Square Numbers
In this squaring numbers activity, learners use a hundred chart to shade in the answer to squared numbers. Students begin with 1 x 1 and shade in the answer. Learners then continue with 2 x 2 and shade that answer, going all the way to...
Curated OER
Graph it!
Sixth graders view a Stacked Graph, and discuss what it shows. Students discuss the basics of graphing: labels, intervals, legends x and y axis... Students create individual stacked graphs from provided information. Students view a...
Curated OER
Combination Factory
Fourth graders use cut-outs of clothing to illustrate the numbers of combinations of articles of clothing they can create. Students create a tree-diagram and count the number of possibilities. They practice showing the information in...
Curated OER
Light and Living Things
In this science worksheet, students answer a question about the distribution of light and then three others using logic and observation skills.
Curated OER
New Ways to Measure
Students recognize that measuring tools can come in many different shapes and sizes. In this early childhood math lesson plan, students develop creative-thinking, math, and social skills as they use nontraditional measuring tools.
Curated OER
DNA and Protein Synthesis
Tenth graders work with a partner, and copies of the attached worksheet "Amino Acid Codon Table" They discuss ways an organism, obtains and uses proteins. Students view a teacher prepared DNA strand banner, and record the complementary...
Curated OER
One-to-one Correspondence
Students count and keep track of objects using one-to-one correspondence. By moving, touching and pointing to objects they organize counting to determine the number in a set accurately. This helps students to practice the skill of...
Houghton Mifflin Harcourt
Math Skiils: Comparing Integers on a Number Line
Here is an attractive assignment that instructs learners how to compare more than one integer on a number line. After the lesson, three practice problems follow. They require learners to place integers on a number line and then order...


