Curated OER
Survey and Tally
Second graders view a model of a survey and tally. In this survey and tally instructional activity, 2nd graders decide on questions for a survey. Students conduct the survey and tally their results. Students create a...
National Security Agency
Starting a Restaurant
Through an engaging unit, chefs-in-training will sort and classify data using tally charts. Learners will also create bar graphs to display restaurant data and interpret data from bar graphs using a variety of categories....
Curated OER
Graphing
In this graphing worksheet, 5th graders identify and graph 20 different problems on the 3 different graphs shown on the sheet. First, they use the tally of callers organized by the school to complete the three different types of graphs....
Curated OER
Ice Cream Scoop
In this data display learning exercise, students write 6 flavors of ice cream on pieces of paper. Kids choose papers one at a time and keep track on a tally sheet. Students make a bar graph of the results.
Math Moves U
Collecting and Working with Data
Add to your collection of math resources with this extensive series of data analysis worksheets. Whether your teaching how to use frequency tables and tally charts to collect and organize data, or introducing young...
Curated OER
Data Collection and Presentation
Middle and high schoolers collect and analyze data from four different activities. The activities include information about classmates, tallying colors of cars in a parking lot, stem and leaf plots, and making a histogram from...
Curated OER
Probability
In this probability activity, 8th graders solve and complete 15 different problems related to determining the probability of various events. First, they complete the table illustrated on the sheet. Then, students use the table to respond...
Curated OER
Counting Coins
Second graders identify a quarter, dime, penny, nickel, and dime. They match the coin with it's monetary value, collect data on excel spreadsheet, and create a graph in Excel. Students participate in group activities.
Curated OER
Where We Live
Who has the most? Young learners practice charting data using familiar information. They help fill out a classroom chart by recording the number of people, pets, televisions, etc. in their home. Guiding questions help them investigate...
Curriculum Corner
St. Patrick's Day Themed Math and Literacy Practice
Look no further for St. Patrick's Day-themed math and literacy practice worksheets. Math skills allow for practicing counting to 100 by 5s, 10s, and 1s, as well as 10 more or 10 less, writing numbers in word and standard form,...
Curated OER
Graphing
Intended for a faith-based classroom, this instructional activity requires second graders to create a survey, conduct the survey in multiple classrooms, and graph the results. They can choose between creating a picture or bar graph, or...
Curated OER
Did You Eat That! - Food Graph
In this health and diet instructional activity, students ask ten of their friends what their favorite vegetables are. Then they tally their votes and shade them in on the graph provided.
Curated OER
Presentation of Quantitative Data- Vertical Line Diagrams
In this quantitative data worksheet, students examine how vertical line diagrams can be used to display discrete quantitative data. They read about the use of tally charts to create vertical line graphs that display the data. They...
Curated OER
Trumpet of the Swan
In this literature worksheet, students, after reading the book Trumpet of the Swan, survey their friends to find out who was their favorite character from the novel. Students keep a tally sheet with their findings on it.
Curated OER
Favorite Food Survey Recording Sheet
In this favorite food survey recording worksheet, students use the survey sheet to collect data about favorite foods. They fill in the name and favorite food of the people they survey.
Curated OER
Caring for a Pet
Students identify the responsibilities of pet owners. In this animal welfare lesson, students read the book Animals As Friends and list the characteristics of a good pet owner. Students use a tally sheet to determine what pets students...
Curated OER
The Die Is Cast
Second graders use tally marks to tabulate and count the number of times each number on a die is rolled.
Curated OER
Displaying the Data
Learners gather facts about their parent's families through the completion of parent interview forms. Using tally marks, the data gathered is counted, transferred to graphs and used to create family timelines.
Beacon Learning Center
Spotted Stones Linked Just Right
Discover how to play the game of dominoes using mental math skills to solve equations that earn points. Pupils become fast critical thinkers in determining which unknown addend tally up points in their favor.
Curated OER
Data Analysis Challenge
In this data analysis worksheet, young scholars work with a partner to collect information for a survey. The information is then compiled into a graph. Students must indicate their survey question, the target audience, predict the...
Shodor Education Foundation
Two Colors Applet
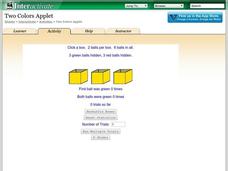
Find the box with two green balls. The applet uses six balls, three green and three red, and hides them in three boxes. Pupils choose a box and click on it to reveal the color of balls inside. Using the chosen box, the simulation keeps...
Curated OER
Chucky Chickadee's Bird and Breakfast: Sing in Please
Young scholars observe bird feeding and complete a tally and graphing activity for their observations. In this bird graphing lesson, students work in teams to observe bird feedings. Young scholars complete a bird reporting sheet and...
Curated OER
Investigation-What are My Chances?
Second graders explore probability. In this math lesson plan, 2nd graders discuss the possibility of choosing a certain colored tile from a bag. Students perform experiments and describe the outcomes as certain, possible, unlikely and...
Curated OER
And the Survey Says...
Students use technology to input, retrieve, organize, manipulate, evaluate, and communicate information; apply appropriate technologies to critical thinking, creative expression, and decision-making skills. They collect and explore data...


