Code.org
The Need for Programming Languages
LEGO see if you can recreate my design. Individuals build an arrangement from LEGO blocks and write directions for someone else to follow in order to recreate the arrangement. Pairs then swap directions and try to...
Code.org
The Need for Algorithms
Pairs work through two scenarios that require them to generate an algorithm. The first activity requires pairs to define a common language to use; the second comes with the language. The pairs then must determine how to code the...
Code.org
Using Simple Commands
Turtles might be slow, but class will zoom by when your pupils build a program in which reptiles draw a grid. Using App Lab and JavaScript, class members build a program to find the most efficient way to draw an image of a...
Code.org
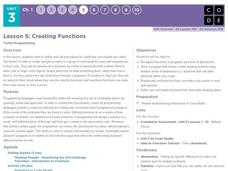
Creating Functions
Quit repeating yourself ... you can make this simpler! Rather than repeating the same set of code over and over, class members learn to build and call functions in a series of challenges in App Lab. In the end, they combine...
Code.org
Functions and Top-Down Design
Let me break it down for you! Introduce your class to a way of breaking up a complicated task into its component pieces. Individuals draw a complex figure using JavaScript and then break it down to help determine the...
Code.org
APIs and Using Functions with Parameters
Introduce your class to the API, a reference guide that lists and explains the functionality of programming language. Using JavaScript, individuals draw complex designs that require additional commands and parameters defined in the...
Code.org
Looping and Random Numbers
Repetition, repetition, repetition. Get your class to efficiently repeat a section of code over and over again by introducing looping. Class members learn looping to quickly recreate objects they want to appear more than once in their...
Code.org
Practice PT - Design a Digital Scene
The final performance task for the unit requires class members to utilize what they have learned to create a personal digital scene. Groups work together to develop a scene and then, using top-down design, break the scene into...
Discovery Education
Design a Shoe
If the shoe doesn't fit, design a new one. Discovery Education challenges pupils to put the engineering process in action by designing a shoe. Groups design and build a shoe prototype based upon the client...
Teach Engineering
Above-Ground Storage Tanks in the Houston Ship Channel
Introduce your class to storage tank failures caused by major storms with an activity that looks at how the concepts of Archimedes' Principle and Pascal's Law affect the storage tanks along the Houston Ship Channel. The background...
Jason Learning
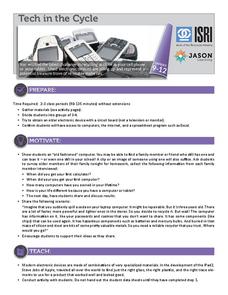
Tech in the Cycle
It might not be easy, but it is worth recycling electronics. Small groups determine the percentage of the materials that make up an iPad 2 and display the information in a circle graph. They then research the recycling process for...
Teach Engineering
Projections and Coordinates: Turning a 3D Earth into Flatlands
Introduce your class to map projections and coordinates, the basics for the work done in a GIS, with an activity that uses Google Earth to challenge learners to think about the earth's shape.
Teach Engineering
Nanotechnology as a Whole
It's a small (nanotechnology) world after all! The first segment of a six-part series gives an overview of nanotechnology, its principles and applications, and shares some of the engineering applications of nanotechnology. A...
Rochester Institue of Technology
Meal Picking
Scholars explore systems design and its relation to meal picking by using computer simulations to test systems designs. They learn about the Pick-to-Light System and calculate average picking times.
Rochester Institue of Technology
Ergonomic Packing
Pupils revisit the concepts of ergonomics and order picking examined in previous lesson and use the results of a simulation to brainstorm ergonomic designs for medical supply stations.
Teach Engineering
Graphing Equations on the Cartesian Plane: Slope
Slopes are not just for skiing. Instructors introduce class members to the concept of slope and teach them how to calculate the slope from a graph or from points. The lesson also includes the discussion of slopes of parallel and...
Teach Engineering
Density and Miscibility
The liquids did not mix — so what do density columns have to do with it? The seventh part in a series of nine provides the theoretical explanation of why density columns do not mix. The lesson covers the topics related to...
Curated OER
Solving a Simple Maze
It is a-maze-ing how lost one can get. Teams reconstruct a simple maze and solve it. Participants create an algorithm that a robot would follow in order to solve the maze as well. The activity includes an extension directing pupils to...
Teach Engineering
Capillarity – Measuring Surface Tension
How do cohesion and adhesion work together? The third installment of a nine-part series teaches young scientists the difference between adhesion and cohesion. They also learn how cohesion and adhesion work together to cause capillary...
Teach Engineering
Superhydrophobicity – The Lotus Effect
Discover and demonstrate the Lotus Effect and superhydrophobic surfaces with the eighth installment of a nine-part series that teaches scholars about surfaces that exhibit superhydrophobicity. The lesson continues also describes...
Teach Engineering
Forms of Linear Equations
Linear equations are all about form. The fifth part in a unit of nine works with the different equivalent forms of linear equations. Class members become familiar with each form by identifying key aspects, graphing, and converting...
Science NetLinks
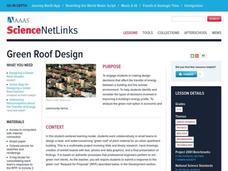
Green Roof Design
Green roofs aren't just eco-friendly — they are literally green with trees. Groups learn about the concept of green roofs in order to be able to design one. The groups design a 5,000-square-foot green roof for a fictional apartment row...
College Board
AP® Computer Science A: Elevens Lab Student Guide
Looking for a project to use in an AP® Computer Science class? Engage learners with a simple solitaire game called Elevens. Through these activities, learners break down the task and write the code for a game. Sign in to your College...
Teach Engineering
Android Acceleration
Prepare to accelerate your Android. Pupils prep for the upcoming activity in this third installment of a four-part series. The lesson progresses nicely by first introducing different types of acceleration to the class. The teacher...
Other popular searches
- Computer Lab Behavior
- Computer Lab Safety Rules
- Technology Resources Word
- Computer Lab Activities
- Computer Lab Rules
- Computer Lab Safety
- Computer Lab Projects
- Computer Lab Lessons
- Computer Lab for Equations
- Safety in Computer Lab
- Computer Lab Procedures
- Integer Computer Lab


