Curated OER
Dissolved Oxygen and Temperature
Students are shown how temperature affects dissolved oxygen and they create a graph showing this relationship. They think about the adaptations of animals to live in different water temperatures. Students test four different water...
Chicago Botanic Garden
Historical Climate Cycles
Ice core samples give scientists access to climates of old—those from more than 800,000 years ago. Through an analysis of various temperature graphs from ice cores, tree rings, and weather stations, scholars compare historical climates...
Curated OER
A Day at the Beach
Help learners determine the rate of change for the temperature of sand. They will collect data on the temperature of wet and dry sand over time with a heat lamp overhead. Then make a scatter plot of the data and find a linear model to...
Curated OER
A Sweet Drink
Students investigate reaction rates. In this seventh or eighth grade mathematics lesson, students collect, record, and analyze data regarding how the temperature of water affects the dissolving time of a sugar cube. Studetns determin...
Center Science Education
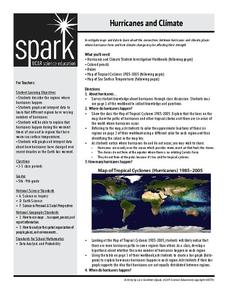
Hurricanes and Climate
Feeling under the weather? This lesson on hurricanes can whip things up! With professionally designed maps and handouts, teach your future weathermen (or women) where, when, and how hurricanes occur. They identify hurricane regions and...
Curated OER
Burning Up! A Look at Global Warming
Students investigate global warming. In this global warming lesson, students watch movies about global warming, discuss problems in their local community and see how communities have changed over time. Students realize the importance of...
Chicago Botanic Garden
Climate Change Around the World
You know climate change is happening when you see a bee take off its yellow jacket. Part four in a series of five lessons explores all factors affecting climate change: temperature, cloud cover, precipitation, and carbon dioxide. By...
Curated OER
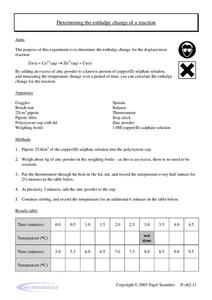
Determining the Enthalpy Change of a Reaction
In this enthalpy of reactions instructional activity, learners use a known amount of copper (II) sulphate solution and an excess of zinc powder to calculate the enthalpy change of the reaction. Students measure the temperature change...
National Wildlife Federation
Is It Getting Hot in Here, or Is It Just Me?
Currently, only 2.1% of global warming is felt on continents, while over 93% is felt in the oceans. The fourth lesson in the series of 21 on global warming is composed of three activities that build off one another. In the first...
Consortium for Ocean Science Exploration and Engagement (COSEE)
Carbon Dioxide & Krill: Impacts
What effects do temperature and carbon dioxide levels have on the zooplankton of Antarctica? This concluding lesson plan in a short unit on climate change and the ocean helps environmental scientists answer these questions. After...
Chicago Botanic Garden
Climate Change Around the World
It is unknown if cloud cover increases in response to carbon dioxide levels changing, helping climate change slow down, or if cloud cover decreases, allowing Earth to warm faster. Part four in the series of five lessons has classes...
Chicago Botanic Garden
Review and Assessment: Causes and Effects of Climate Changes
The last activity in the series of five is a short one where individuals show what they've learned about the causes and effects of climate change. Working independently, they fill in a graphic organizer, then compare their notes with a...
US Environmental Protection Agency
Weather and Climate: What's the Difference?
Future weather forecasters collect daily temperatures over a period of time. Afterward, they compare their data with monthly averages, as researched on national weather websites, in order to grasp the difference between weather and...
NOAA
Communicate!: Create a Unique Message About Climate Change
Scholars use their communication skills to express their take on climate change in the ninth installment of the 10-part Discover Your Changing World series. They create ways to deliver their messages on a specific aspect of climate by...
McGraw Hill
H-R Diagram
As a star ages its composition, size, and temperature change. Using an interactive simulation, learners explore these changes over the lifetime of a star. They see the change in temperature and luminosity graphically and a visual...
Curated OER
Climate Change
Rising sea levels, strong storms, melting ice ... who or what is to blame? Scholars browse the website in preparation for a class discussion or debate about whether human activity is causing climate change. They gain a balanced...
Curated OER
Ice Cream Lab
I scream, you scream, we all scream for ice cream! Even high schoolers enjoy making ice cream. This laboratory exercise has them record the temperature changes throughout the process of liquid becoming solid, graph the results, and...
Curated OER
Using Vegetation, Precipitation, and Surface Temperature to Study Climate Zones
Middle schoolers begin their examination of the climate zones found around the world. Using a software program, they identify the relationship between the vegetation, climate and temperatures of the different zones. They also plot...
Curated OER
The History of Climate Change
In this science worksheet, students gather in-depth information dealing with climate change over the next century. They analyze the grid to determine the average time difference between peaks in the temperature history for the last...
Illustrative Mathematics
The High School Gym
Learners apply critical thinking skills as they analyze data about the temperature inside a gymnasium during a school assembly. The focus is on representing temperature as a function of time and interpreting input and output values...
Curated OER
Change Since 1609
Students recognize how the climate of the Hudson Valley has changed since the last glaciation. They explain these changes using a reconstruction of the land use changes in the Hudson Valley composed of confetti, Ziploc bags and other...
NASA
Melting Ice: Designing an Experiment
Sometimes, despite the best laid plans, the unexpected will occur. Learners witness this firsthand as they carefully design an experiment to determine the time needed for ice to melt in salt water or pure water. They uncover facts not...
Curated OER
How Does Temperature Vary Over Time?
Students examine the temperature flucuations on the Earth. After defining new vocabulary, they identify the flucuations of the Earth on a map. As a class, they develop a hypotheis on the temperature variation by examining the data.
NASA
Earth's Global Energy Budget
Introduce your earth science enthusiasts to the earth's energy budget. Teach them using an informative set of slides that include illuminating lecturer's notes, relevant vocabulary, embedded animations, colorful satellite maps, and a...


