Illustrative Mathematics
Rolling Dice
Rolling dice is a great way for your mathematicians to get a hands-on approach to probabilities. Use the chart to record whether they rolled a six during ten attempts. Calculate results individually (or in small groups) and then record...
Curated OER
"Lucky Charms": Interpreting Data and Making Predictions
Seventh graders determine if a "lucky charm" will increase their chances of winning a game. Students calculate the experimental probability of each player in a game. They observe and collect data from each activity. Students compare the...
Curated OER
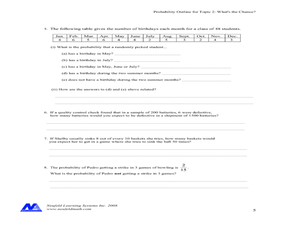
Concept: What's The Chance?
In this concept worksheet, students perform probability experiments. Using collected information, they interpret the data. Students answer questions about probability. This five-page worksheet contains approximately 15 multi-step...
Alabama Learning Exchange
Bear Factory Probability
By examining a set of dice roll data, statisticians determine the probability of different sums occurring. They visit an interactive website and determine how many different vacation outfits Bobbie Bear will have based on the colored...
Curated OER
Risk Taker - Probability Web Quest
Young scholars complete an on line, teacher created, webquest to study the origin of probability, theoretical and simulated probability; computing the probability of two independent events; and mutually exclusive events. They make a Venn...
Curated OER
"Probably Pistachio" by Stuart J. Murphy
Students use manipulatives and examine situations where probability can be used.
Curated OER
Probability and ICT Integration
Eighth graders use the internet and calculators to explore theoretical and experimental probability. Using a program on the calculator, 8th graders simulate a coin toss and a spinner to figure probability. They also perform classroom...
Curated OER
Probability and Expected Value
Students collect data and analyze it. In this statistics lesson, students make predictions using different outcomes of trials.
Texas Instruments
Probability of Repeated Independent Events
Statisticians analyze different samples to find independent and dependent events. For this probability lesson, pupils predict the outcome and then calculate the real outcome. They create a tree diagram to help predict the probability of...
Curated OER
Theoretically Speaking
Students define probability. They determine outcome from a given situation based on simple probability. Students create experimental data using a coin and a number cube. They write how theoretical and experimental probability are different.
Curated OER
Chaos
Students experiment with several chaotic simulation, they build a working definition of chaos. Students reinforce their knowledge of basic probability and percents. They are reminded of previous knowledge that is pertinent to this...
Curated OER
ng Data: Probability, What's in the bag?
Students use the language associated with probability to discuss events including those with equally likely outcome. They collect data from a simple experiment and record in a frequency table: estimate probabilities based on this data
Curated OER
Probability
Fifth graders explore simple probability. Using a specified website, they play a "Fish Tank" game where they determine the chances of selecting a red fish from an aquarium. Students answer probability problems and convert fractions to...
Curated OER
What are My Chances?
Students calculate the chance of an event occurring. In this statistics activity, students use combination and permutation to calculate the probability of an event occurring. They differentiate between theoretical and experimental...
Curated OER
Let's Take a Chance!
Students investigate probability and the chance of an even happening. In this algebra lesson, students incorporate their knowledge of probability to solve problems and relate it to the real world. They learn to make decisions based on data.
Curated OER
M & M Candy: I Want Green
Eighth graders use colored candy pieces (such as M & M's) to compare mathematical expectations and experimental probability. They pick pieces of candy randomly, and graph their results. This classic activity never fails to engage...
Project Maths
Fair Trials with Two Dice
Life's not fair, but dice games should be. After playing a two-person game with a pair of dice, scholars investigate the fairness of the game. They consider the number of possible outcomes using the fundamental counting principle and...
Curated OER
What are the Chances: A Game of Chance!
Sixth graders experiment with dice, playing cards, pennies and computer-generated simulations to calculate probability. They use compiled data to make predictions.
Shodor Education Foundation
Tree Diagrams and Probability
Aspiring statisticians create tree diagrams and figure probabilities of events based on those diagrams. They practice adding and multiplying fractions and explain complementary probabilities. Students use computers activities to make...
Curated OER
Probability and Statistics
Learners are taught to search the internet for statistics concepts on sports. In this probability lesson plan, students collect data and use the calculator to graph and analyze their data. They graph and make predictions about sports...
Curated OER
Geometric Probablitiy: Spinners and Dartboards
Sstudents explore and analyze the properties of geometric areas. In this geometry lesson plan, sstudents use technology to simulate spinners and dartboards in order to fing areas of circles and sectors of circles and compare and...
Curated OER
Data and Probability- What's the Chance?
Young scholars investigate probability through a game. In this data lesson, students use dice and predictions to explore how probability works.
Curated OER
What's in the Bag?
Students calculate the probability of an event occurring. In this statistics instructional activity, students calculate the outcome using combination and permutation. They differentiate between-theoretical and experimental probability.
Virginia Department of Education
The Real Meal Deal
Burgers and salads and sodas, oh my! Scholars use a menu to investigate the Fundamental Counting Principle. They create tree diagrams to illustrate the number of possible choices for each given scenario.


