Curated OER
Jumping Rope-How Fit Am I?
Learners collect data over a 10-week period in their Physical Education class on how many jumps they can do in a minute period or another time period specified by the instructor.
University of Illinois
University of Illinois Urbana Champaign: Ti 82 Calculator Tutorial
This site gives an in depth tutorial on the TI-82 graphing calculator. With each step in the tutorial, a picture of the calculator is shown that can be enlarged.
Richland Community College
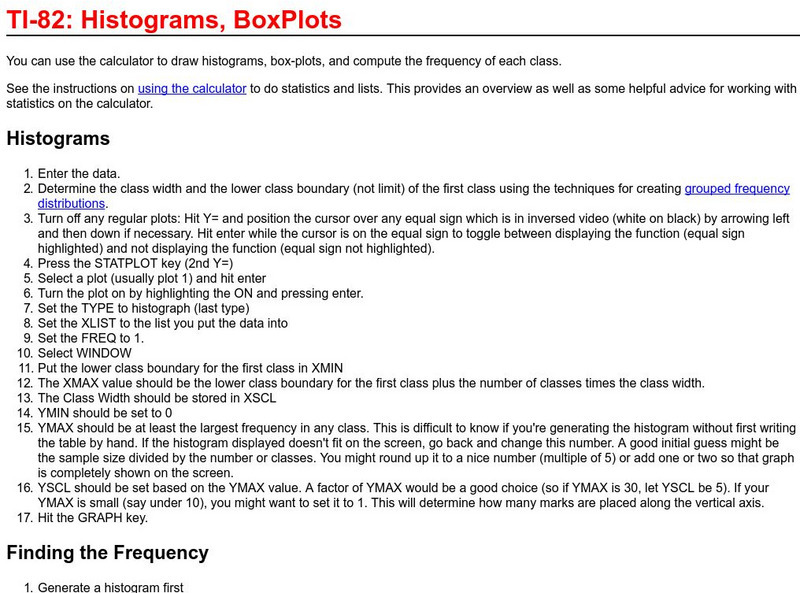
Richland College: Ti 82 Histograms / Box Plots
Richland College provides a step-by-step procedure on how to use a TI-82 to construct histograms and box plots and then use this to find frequency distribution.
Other
Ostermiller.org: Between Curves Tools
This site provides instructions for programs you can put into a graphing calculator to find the area between curves.


