Curated OER
Transformation
In this transformation worksheet, students identify and solve 10 different problems that include various images. First, they determine whether each object illustrated is a mirror image or reflection of the other image in the problem....
Illustrative Mathematics
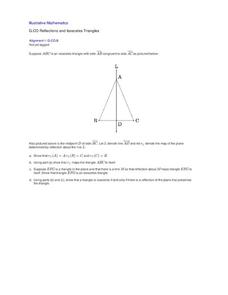
Reflections and Isosceles Triangles
Geometers explore symmetries of isosceles triangles by using rigid transformations of the plane. They complete four tasks, including congruence proofs, which illustrate the relationship between congruence and rigid transformations. The...
Curated OER
Math/Technology: Symmetry
Fourth graders, using KidPix, use stamps and pencil tools to illustrate which pictures have symmetry. They add text boxes to explain their answers in math terms. Students practice skills in rotation, reflection, and translation on an...
Curated OER
Quilt Geometry
Seventh graders explore lines of symmetry, congruent polygons and patterns. They listen to "The Seasons Sewn," observe a PowerPoint presentation, and identify congruent polygons and visual patterns. Through an internet activity, 7th...
Curated OER
Geoboard Ideas
Learners build polygons on their geoboards. In this geometry lesson plan, students build and then draw it on paper and label it. Learners then switch with a partner to try an make a symmetrical shape.
Curated OER
Worksheet 12
In this math worksheet, students explain the vector parametric equation for a line, scalar parametric equations, symmetric equations, and the implicit equation for a line.
Curated OER
Constructing Perpendicular Bisectors
Tenth graders investigate parallel lines and the angles formed when cut by a transversal. For this geometry lesson, 10th graders construct perpendicular lines and discuss midpoint, segments and perpendicular bisectors. They relate...
Houghton Mifflin Harcourt
Unit 3 Math Vocabulary Cards (Grade 1)
Reinforce math vocabulary with a set of flashcards. Each card showcases a boldly typed word or a picture representation with labels. The topics are geometry related and include terms such as cones, faces, pyramids, sides, and...
West Contra Costa Unified School District
Key Features of Graphs
The key is ... After a day of instruction on key features of graphs, groups create a poster and presentation on the key features of their given function graph. The resource provides an extension activity of "telephone" using...
Los Angeles County Office of Education
Assessment For The California Mathematics Standards Grade 4
Have scholars show what they know with a 20-page assessment aligned to the California State Standards. The test covers concepts such as large and whole numbers, all four mathematical operations, fractions, decimals, geometric figures,...
Houghton Mifflin Harcourt
Unit 8 Math Vocabulary Cards (Grade 5)
Reinforce math vocabulary with a set of flash cards. With a total of forty-eight cards, each are printed in bold font, and include definition cards that offer a labeled example. Terms include absolute value, ordered...
Curated OER
Building Big and Strong
Middle and high schoolers explore the concepts of architectural rigidity. They analyze a variety of polygons, and explain why some shapes add more strength to structures than others. The PBS video, "Building Big," is utilized in this plan.
Balanced Assessment
On Averages and Curves
Determine the average on a curve. The class finds graphical representations of averages and expresses them both symbolically and on the graph. The assessment requires class members to justify using average to describe graphs.
Curated OER
Radial Balance Geometric Shapes
Fifth graders create a radially balanced design using geometric shapes which exhibits their prior knowledge of symmetry. They use a kaleidoscope image to develop a design using markers or colored pencils.
Curated OER
Clay Tile: Art Deco Style
Students analyze and classify sets of pictures using a mathematical classification system and create original works of Art Deco tiles using this new knowledge and four types of symmetry.
Curated OER
More No-Three-In-A-Line
Fourth graders read Mary's problem and make sure that they examine it.
After some discussion, let the class work on the problem in their groups.
They then take turns in putting a picture of their arrangement on the board.
Curated OER
Invertebrates
Middle schoolers examine invertebrates. In this animal classification lesson, students discuss invertebrates and bilateral symmetry. They discuss the importance of horse shoe crabs in medical science.
Curated OER
Tantalizing Tangrams: What Are Transformations?
Students use the Internet to learn about transformations and tessellations. In this geometry lesson plan, students use the Internet to define the meaning of reflections, translations, rotations, glide reflection and symmetry. ...
Curated OER
Coordinate Plane
Tenth graders plot points on a coordinate plane. In this geometry lesson plan, 10th graders identify the different quadrants, plots points on a number line and coordinate plane and solve for the midpoint of line segments.
Curated OER
Quilt Squared
Learners study West Virginia quilts. In this mathematics lesson, students use symmetry, geometric shapes, and patterns to create their own quilt square.
Curated OER
Evaluating Simple Probabilities
In this Statistics and Probability worksheet, students solve problems involving simple probability. The one page worksheet contains five multiple choice questions. Answers are provided.
Curated OER
In The Eye Of The Beholder
Young scholars identify and define definitions of beauty and perfection in Chinese and
Japanese art and compare those definitions to other cultural beliefs and societies. This instructional activity includes a two-part instructional...
Inside Mathematics
Sorting Functions
Graph A goes with equation C, but table B. The short assessment task requires class members to match graphs with their corresponding tables, equations, and verbalized rules. Pupils then provide explanations on the process they used to...
EngageNY
Analyzing a Graph
Collaborative groups utilize their knowledge of parent functions and transformations to determine the equations associated with graphs. The graph is then related to the scenario it represents.


