Curated OER
Exploring Our Country: An United States Scavenger Hunt
Young scholars visit a selected web site and search answers to given questions. They investigate census data for a several states. They explore data such as business, geography, and people. Students demonstrate ways to navigate...
National Endowment for the Humanities
African-American Communities in the North Before the Civil War
Middle schoolers may be surprised to learn that before the American Civil War there were more slaves living in New York than there were in Kentucky! Young historians examine maps and census data to gather statistics about...
Curated OER
Race and Ethnicity in the United States
Students explore race and ethnicity as it is defined by the U. S. Census Bureau. They compare data from 1900, 1950, and 2000 and identify settlement patterns and changes in population. In groups, they map these changes and discuss...
Global Oneness Project
Citizen Photojournalism
Matt Black's photo essay, "The Geography of Poverty" provides a shocking reminder of the poverty that exists in the United States. The resource not only focuses attention on poverty but also conditions that have given rise to situation...
Curated OER
United States Population: Using Quadratic Models
In this United States population worksheet, students solve word problems about the United States population by using the quadratic formula. Students complete 6 problems.
Curated OER
Arthur Young and the President
High schoolers work with NASS data by converting it into prose. For this historical agriculture information lesson, students read about how George Washington communicated information about crop yields, livestock, and land values. They...
Education World
The African American Population in US History
How has the African American population changed over the years? Learners use charts, statistical data, and maps to see how populations in African American communities have changed since the 1860s. Activity modifications are included to...
Curated OER
Mapping Population Changes In The United States
Students create a choropleth map to illustrate the population growth rate of the United States. They explore how to construct a choropleth map, and discuss the impact of population changes for the future.
Curated OER
A Class Census
Students recognize that data represents specific pieces of information about real-world activities, such as the census. In this census instructional activity, students take a class and school-wide census and construct tally charts and...
Curated OER
Using Real-Data from North Dakota to Study Place Value, Rounding, Estimation, Fractions, and Percents
In this real-data activity, students use data from the 2008 Census Bureau to answer eight questions divided into four activities. The topics covered include: place value, rounding, estimation, fractions, and percents.
Curated OER
Makiing Sense of the Census
Students investigate trends in agriculture. In this secondary mathematics lesson, students evaluate agricultural census data from 1982 to 2202 as they compare the properties of the mean and the median. Students explore what sorts of...
Curated OER
Numbers Tell a Story
Learners connect census data to historical events. In this civics lesson plan, students understand cause and effect, and how they are reflected in census data and analyze census data for social and economic significance.
Curated OER
Then and Now
Learners conduct research and use census data to compare different times and places. In this census lesson, students interpret data from charts and graphs, comparing census information from two time periods as well as from two different...
Curated OER
Where Do I Live?
Young scholars gain a better understanding of the population of the region they live in by comparing U.S. census data on the internet.
Curated OER
Mapping the Census
Students learn why the census makes a difference. In this U.S. Census lesson plan, students learn the key elements of cartography, examine the difference between data and their representation, and create a map using census data.
National Endowment for the Humanities
People and Places in the North and South
North and South: two opposite directions and two opposite economic and social systems in time of the Civil War. Pupils peruse census websites and primary source photographs to understand what life was like for the everyday person before...
Curated OER
Was There an Industrial Revolution? New Workplace, New Technology, New Consumers
High schoolers examine the changes in the U.S. in the period of industrialization before the Civil War. They analyze census data, list/describe inventions and innovations, explore various websites, conduct a Factory Simulation activity,...
CK-12 Foundation
Interpretation of Circle Graphs: Northwest Region Population Pie
Given populations of the five Northwestern states, learners create a circle graph. Using the data and the pie chart, they make comparisons between the populations of the states. Finally, the pupils determine how the chart will change...
Curated OER
Uninsured in America
Students explore the issue of being uninsured in America. In this social issues lesson, students review data about uninsured Americans. Students create and conduct surveys related to the social issue of being uninsured.
Curated OER
Census Data and New Hampshire History
Students graph the population growth of New Hampshire using historical census data.
Curated OER
Surname Survey
Students use data from the U.S. Census Bureau to determine whether last names in a local phone directory reflect the Census Bureau's list of the most common surnames in the country. In this surnames lesson plan, students use the Internet...
Curated OER
Constitution/Impeachment/Reconstruction
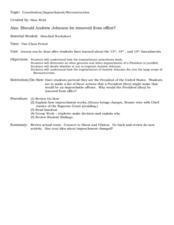
Eleventh graders analyze a chart comparing U.S. census data from 1850, 1880, 1900, and 1920. They read a handout summarizing immigration legislation from 1882-1996 and create a graph charting how open / closed U.S. immigration is over time.
Curated OER
Census Sensibility
Students examine the importance of the census and census data collection methods. They gather statistical data, create graphs comparing state and national populations, and compose written reflections on why the census is necessary.
Curated OER
The Immigrant Experience
Students utilize oral histories to discover, analyze, and interpret immigration and migration in the history of the United States. A goal of the unit is fostering a discussion and encouraging students to make meaning of the bigger...


