Curated OER
Properties of Materials - Part B
Learners describe the history of materials. They use the kinetic (particle) theory to explain changes of state in matter and trace the flow of heat during changes of state and chemical changes.
Curated OER
Earth Forces
Students use geological techniques such as plate tectonics, mountain building, earthquakes, and volcanoes, in order to explain the earth.
Curated OER
Tornadoes
Students examine the characteristics of a tornado. They practice using new vocabulary and participate in a question and answer session. They use the internet to gather more specific information.
Curated OER
A Star Sheds a Comet Tail!
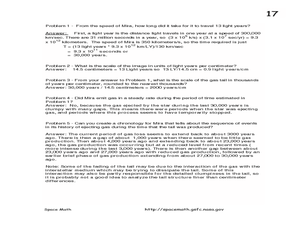
For this comet tails and stars worksheet, students read about the star Mira and the vast clouds of gases it emits. They use a photograph from the Galaxy Evolution Explorer satellite to solve 5 problems about the scale of the image, the...
Curated OER
Air Pollution:What's the Solution?-Weather's Role
In this air pollution and weather worksheet, students collect data using an online animation to determine the air quality at given times along with the wind speed and temperature in a particular city. Students make 3 bar graphs using the...
Curated OER
Marie Antoinette: The Tragic Queen
Students view a documentary on Marie Antoinette, who became a symbol of the reviled monarchy. After viewing, students discuss what they saw then create a family line of Marie Antoinette. They compare maps of Europe from her time to ours.
Curated OER
Hands-On Weather Data Collecting
Fifth graders study weather in their community, in the United States, and around the world. They use thermometers, the beaufort wind scale, and simple weather symbols to measure and record the weather outside their school. They also look...
Curated OER
Soil Composition: Then and Now
Students identify the location of their school from a 1926 digitized Soil Sample map. Using remaining landforms, they determine the type of soil identified during that time, and compare it to the soil currently found near the school.
Curated OER
Mapping the changes in Canada's population
Students find and analyze data found in the census. They compare the population from 1996 to 2001. They explore the type of data they can find in the Census of Population.
Curated OER
Mapping It Out - Great Lessons For Geography
Through geography lesson plans students can learn about history, science, and a variety of other subjects.
Curated OER
Mapping the Village
Students measure, weigh, and document the amount of trash and garbage generated by the school for one day. They brainstorm solutions for trash in the area and assist with the school-wide recycle program.
Curated OER
Geography: Japan Project Online Lesson, Part 2
Students, in small groups, create and exchange map questions and share them with students in Japan. After examining the maps, they compare and contrast the two maps on the county Web Board. Students use a rubric to evaluate their answers.
Curated OER
Globe Lesson 4 - The Compass
Students study compass' and their use in navigation. In this compass lesson, students use a compass and a globe to answer the questions about navigation.
Glynn County School System
Milky Way Galaxy
There is more about the Milky Way that scientists don't know than what they do know—that leaves a lot to discover! A thorough lesson presentation explores the components of the Milky Way Galaxy and their behaviors.
Mathematics Vision Project
Module 7: Connecting Algebra and Geometry
The coordinate plane links key geometry and algebra concepts in this approachable but rigorous unit. The class starts by developing the distance formula from the Pythagorean Theorem, then moves to applications of slope. Activities...
Curated OER
Gapminder World 2012
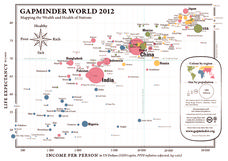
Here is a very interesting infographic that compares the average life expectancies, per capita incomes, and population sizes of every country in the world in 2012.
Channel Islands Film
Arlington Springs Man: Lesson Plan 2
West of the West's documentary Arlington Springs Man and a two-page scientific article about the same topic provide the text for a reading comprehension exercise that asks individuals to craft a one page summary of information gathered...
Curated OER
Magnitude vs Intensity
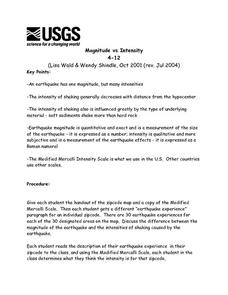
Students use a zipcode map to locate earthquake experiences based on the Modified Mercalli Scale. They discuss the difference of the magnitude of an earthquake compared to the intensity of the shaking it causes.
Curated OER
CEENBoT Takes a Dive
Students create a map to scale using technology. In this algebra lesson, students navigate through a shipwreck to perform rescues. They use he CEENBoT program to perform the different tasks.
Curated OER
Tooling Around Arizona: Measuring Distances
In this measurement worksheet, student measure the distances between Arizona cities by using a the scale on an Arizona Cities map. Students complete 15 problems.
Curated OER
How do we measure global earthquakes?
Students examine three seismograms of a recent South American earthquake recorded by USGS stations. They measure the S-P distance and use a P and S wave travel-time graph to find the epicenter distance for each seismogram. In addition,...
Curated OER
What's Its Slope
Students identify the slope of a lines.In this algebra lesson, students define the meaning of slope and write an equation given the slope. They graph linear functions using the slope and y-intercept.
Curated OER
The Solar System
Learners describe the different bodies that make up our solar system, explain the place of our solar system within the Milky Way Galaxy and the universe, explain day and night and the Earth's movement, and describe the relationship...
Curated OER
Ocean Currents
Fourth graders work in groups to research ocean currents and create posters with their findings. They locate the patterns and names of major ocean currents and identify them on a map. Students also use red pencil to show ocean currents...


