Student Handouts
What's My GPA?
Here is an excellent, detailed one-page reference sheet to introduce students to what a grade point average (GPA) is and how to calculate their own.
Chemistry Collective
Virtual Lab: Acid Dilution Problem
There's no risk of injury when working with virtual HCl! Challenge your young chemists with making calculations to create a 3M solution of HCl from the concentrated acid. They first calculate the correct ratios of HCl and water and then...
Georgia Department of Education
Math Class
Young analysts use real (provided) data from a class's test scores to practice using statistical tools. Not only do learners calculate measures of center and spread (including mean, median, deviation, and IQ range), but...
EngageNY
Interpreting Residuals from a Line
What does an animal's gestation period have to do with its longevity? Use residuals to determine the prediction errors based upon a least-square regression line. This second lesson on residuals shows how to use residuals to create a...
Curated OER
Sunrise, Sunset
What locations on Earth get the longest number of hours of daylight in the summer? Hint: It's not the equator! Use real-world sunrise and sunset data to develop trigonometric models that can be used to estimate the number of hours of...
EngageNY
Events and Venn Diagrams
Time for statistics and learning to overlap! Learners examine Venn Diagrams as a means to organize data. They then use the diagrams to calculate simple and compound probabilities.
Bowland
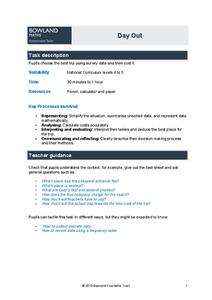
Day Out
Use mathematics to help plan a field trip. Scholars use the results of a survey to determine where a class should go on a field trip. They use provided data about entrance fees and mileage to calculate the cost per person of such a...
EngageNY
Sampling Variability
Work it out — find the average time clients spend at a gym. Pupils use a table of random digits to collect a sample of times fitness buffs are working out. The scholars use their random sample to calculate an estimate of the mean of the...
CK-12 Foundation
Variance of a Data Set
Use variable value sliders to understand variance. The interactive shows four whole numbers, their mean and deviation. Using the information, pupils find the variance of the numbers and respond to question related to the understanding of...
Illustrative Mathematics
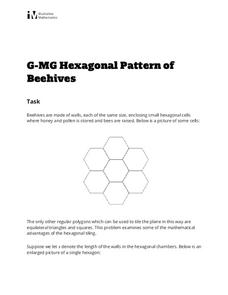
Hexagonal Pattern of Beehives
Young geometers and biologists investigate the math of nature in an activity that is just the bee's knees. Participants will study the tessellations of hexagons in a beehive, along with the natural rationale behind the specific shape....
Teach Engineering
Just Plane Simple
It is plane to see that simple machines help reduce the force needed to perform a task. This resource introduces three of the simple machines--the inclined plane, the wedge, and the screw, and the formulas in order to be able...
Virginia Department of Education
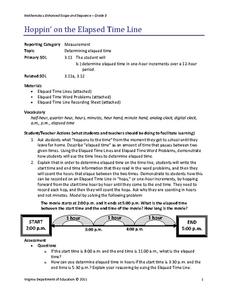
Hoppin' on the Elapsed Time Line
Time flies when you're teaching math! Okay, maybe not for everyone, but this activity will have your young mathematicians calculating elapsed time before you know it.
EngageNY
Interpreting Correlation
Is 0.56 stronger than -0.78? Interpret the correlation coefficient as the strength and direction of a linear relationship between two variables. An algebra lesson introduces the correlation coefficient by estimating and then...
Teach Engineering
Measuring Viscosity
Groups use a marble to determine the viscosity of household fluids. The procedure calls for pupils to measure the amount of time it takes a marble to fall a specified distance in the fluids. Using unit conversions and algebra, the teams...
Teach Engineering
Spring Away!
The last segment of the nine-part unit makes a connection between springs and linear equations. Groups hang weights from the spring and measure its length. Then, using the data collected, they calculate the slope to find the k-value...
Bowland
Olympic Cycling
Teach teenagers to think critically about data. Young data analysts must create two questions that can be answered using a provided data set on Olympic cycling times. Of course, they then have to answer their questions using mathematics.
EngageNY
An Area Formula for Triangles
Use a triangle area formula that works when the height is unknown. The eighth installment in a 16-part series on trigonometry revisits the trigonometric triangle area formula that previously was shown to work with the acute triangles....
EngageNY
Getting the Job Done—Speed, Work, and Measurement Units II
How fast is your class? Learners determine the amount of time it takes individuals to walk a given distance and calculate their speeds. Pupils solve distance, rate, and time problems using the formula and pay attention to the...
CK-12 Foundation
Expected Value: Game of Chance
Determine whether the payoff is worth it. Pupils calculate the expected value of a game with three different payoff levels. Each level has a different probability of winning money. The scholars find the expected payoffs for each...
Shodor Education Foundation
Graphit
No graphing calculator? No worries, there's an app for that! Young mathematicians use an app to graph functions. In addition, they can also plot data points.
College Board
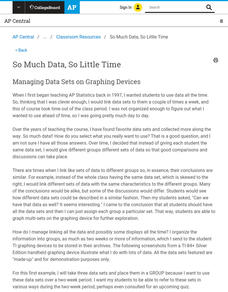
So Much Data, So Little Time
Organizing data in a statistics class is often a challenge. A veteran statistics teacher shares data organization tips in a lesson resource. The instructor shows how to group data to link to individual calculators in a more efficient...
Illustrative Mathematics
The Lighthouse Problem
Long considered the symbol of safe harbor and steadfast waiting, the lighthouse gets a mathematical treatment. The straightforward question of distance to the horizon is carefully presented, followed by a look into the...
EngageNY
Populations, Samples, and Generalizing from a Sample to a Population
Determine the difference between a sample statistic and a population characteristic. Pupils learn about populations and samples in the 14th portion in a unit of 25. Individuals calculate information directly from populations called...
101 Questions
Dandy Candies
Package design is an economic necessity. Young scholars assume the role in an interesting inquiry-based lesson. Given 24 cubic shaped candies to package, they must determine the arrangement that uses the least amount of cardboard to...
Other popular searches
- Division Using a Calculator
- Math Using a Calculator
- Money Using a Calculator
- Graphing Using a Calculator
- Exponents Using Calculators
- Math Using Calculators
- Using a Calculator/an
- Practice Using Calculators


