Curated OER
Mapping the changes in Canada's population
Students find and analyze data found in the census. They compare the population from 1996 to 2001. They explore the type of data they can find in the Census of Population.
Curated OER
Mapping It Out - Great Lessons For Geography
Through geography lesson plans students can learn about history, science, and a variety of other subjects.
Curated OER
Mapping the Village
Students measure, weigh, and document the amount of trash and garbage generated by the school for one day. They brainstorm solutions for trash in the area and assist with the school-wide recycle program.
Curated OER
Coral Bleaching in the Caribbean
Learners use authentic satellite data on the NASA website to determine when the sea surface temperature meets the criteria to induce coral bleaching.
Curated OER
Geography: Japan Project Online Lesson, Part 2
Students, in small groups, create and exchange map questions and share them with students in Japan. After examining the maps, they compare and contrast the two maps on the county Web Board. Students use a rubric to evaluate their answers.
Curated OER
Globe Lesson 4 - The Compass
Students study compass' and their use in navigation. In this compass lesson, students use a compass and a globe to answer the questions about navigation.
Glynn County School System
Milky Way Galaxy
There is more about the Milky Way that scientists don't know than what they do know—that leaves a lot to discover! A thorough lesson presentation explores the components of the Milky Way Galaxy and their behaviors.
Curated OER
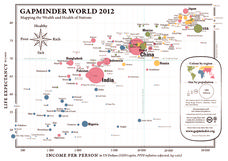
Gapminder World 2012
Here is a very interesting infographic that compares the average life expectancies, per capita incomes, and population sizes of every country in the world in 2012.
Channel Islands Film
Arlington Springs Man: Lesson Plan 2
West of the West's documentary Arlington Springs Man and a two-page scientific article about the same topic provide the text for a reading comprehension exercise that asks individuals to craft a one page summary of information gathered...
Curated OER
Soil Composition: Then and Now
Students identify the location of their school from a 1926 digitized Soil Sample map. Using remaining landforms, they determine the type of soil identified during that time, and compare it to the soil currently found near the school.
Curated OER
How do we measure global earthquakes?
Students examine three seismograms of a recent South American earthquake recorded by USGS stations. They measure the S-P distance and use a P and S wave travel-time graph to find the epicenter distance for each seismogram. In addition,...
Curated OER
Math and Measurement
Students use the correct tool to measure distances. In this geometry lesson, students use an odometer and ruler correctly as they study maps. They describe how far way something is.
Curated OER
Volcanoes
Second graders review the characteristics and aspects of volcanoes. Using this information, they write a creative story and draw illustrations to accompany the words. They use geographical terms to describe a location and the physical...
Curated OER
This Land is Your Land - Delaware
Students determine how land was divided and marked for boundaries in the early days of settlement in Delaware. Students mark out land on the playground according to the methods used by the early settlers. Students write a description of...
Curated OER
Globe Lesson- The Revolutionary War
Students discover using globes. For this geography lesson, students use a globe to outline the original 13 colonies. Students also use a globe to measure the distance from London to New York City and determine how many days it would have...
Curated OER
Searching the Attic
Students conduct field research, including the use of a grid system, in order to discover important or interesting family artifacts.They map discoveries of important artifacts on a grid map in order to track and better analyze...
Curated OER
Measuring Distance and Area in Satellite Images (College Level)
Students are able to download, install, and use Image J image analysis software to quantify change over time in satellite images. They access and download satellite images for specific locations and times. Students set a scale (spatial...
Curated OER
How Healthy is the Wetland?
Students explore wetlands. In this ecology activity, students visit a wetland site and collect data about the wetland functions. Students record their results and use the data recorded to rate the wetland site on its function.
Curated OER
Refugees
Sixth graders use the internet as well as personal interviews to research refugees and refugee status from a Canadian and international perspective.
Curated OER
Similar Triangles - Applied Problems
Students differentiate between similar and congruent triangles. In this geometry lesson, students identify the angles of triangles using the similarity theorem. They apply concepts of triangles to the real world.
Curated OER
A Bird's Eye View of our 50 States
Third graders focus on state birds as they learned absolute location (latitude/longitude) of each state, as well as their relative location (bordering states).
Curated OER
Country Mouse, City Mouse?
Students recognize the characteristics of a rural area. They analyze land use to determine whether the map is of a rural (country) area or an urban (city) area.
Curated OER
Magnitude vs Intensity
Students use a zipcode map to locate earthquake experiences based on the Modified Mercalli Scale. They discuss the difference of the magnitude of an earthquake compared to the intensity of the shaking it causes.
Curated OER
CEENBoT Takes a Dive
Students create a map to scale using technology. For this algebra lesson, students navigate through a shipwreck to perform rescues. They use he CEENBoT program to perform the different tasks.
Other popular searches
- Using Map Scale Distance
- Proportions Using Map Scale
- Using Scale on Maps
- Maps Using Scale
- Using a Scale Map


