Illustrative Mathematics
Walk-a-thon 2
During a walk-a-thon your learners must determine the walking rate of Julianna's progress. Using tables, graphs, and an equation, they must be able to calculate the time it took her to walk one mile and predict her distance based on the...
EngageNY
Coordinates of Points in Space
Combine vectors and matrices to describe transformations in space. Class members create visual representations of the addition of ordered pairs to discover the resulting parallelogram. They also examine the graphical representation of...
EngageNY
The Graph of a Function
Mathematics set notation can be represented through a computer program loop. Making the connection to a computer program loop helps pupils see the process that set notation describes. The activity allows for different types domain and...
Curated OER
How Big Is The Playground?
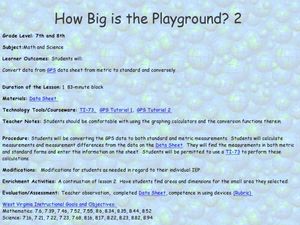
Students calculate the standard and metric measurements of a playground. In this measurement instructional activity, students use GPS coordinates and graphing calculators to determine the dimensions of an area outside of the school in...
Radford University
How to Calculate and Analyze the Equation for a Parabolic Path
Working in groups, pupils plot three points on the coordinate plane representing three different parabolic paths. Using a calculator, they determine the quadratic regression equation for their models. Each team then figures out the...
Curated OER
Line 'Em Up!
Students find coordinate points on a grid and create a line graph with those points. This lesson should ideally be used during a unit on various types of graphs. They make and use coordinate systems to specify locations and to describe...
Mathematics Vision Project
Modeling Data
Is there a better way to display data to analyze it? Pupils represent data in a variety of ways using number lines, coordinate graphs, and tables. They determine that certain displays work with different types of data and use two-way...
Curated OER
Gra[hing Linear Equations
In this Algebra I learning exercise, 9th graders use the slope and y-intercept to graph a linear equation and fill in a table with the coordinates of the five points plotted. The seven page learning exercise contains fourteen problems. ...
Curated OER
Scatter-Brained
Seventh graders graph ordered pairs on a coordinate plane. They create a scatterplot. Additionally, they determine the line of best fit and investigate the slope of the line. Multiple resources are provided. An excellent resource!
Del Mar College
Solving Systems of Equations
Lets keep the system working and show learners the three ways to solve linear systems of equations. Each method includes step-by-step instructions to work their way through the problem. The same problem is used for each method to show...
Mt. San Antonio Collage
Test 2: Rationals, Exponentials, and Logarithms
Running out of logarithm questions in class? The nicely organized two-page activity provides practice in rational, logarithmic, and exponential functions. All the topics include graphing, solving, and finding domain and range.
Curated OER
Identifying Points in the Coordinate Plane
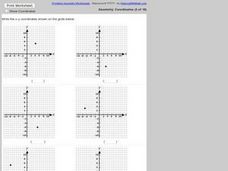
In this ordered pairs instructional activity, learners identify 6 ordered pairs given a coordinate plane. Students list the ordered pair given the graph.
Curated OER
Are You Coordinated?
First graders are introduced to a coordinate graph. They are given a graph and follow directions to place stickers in the designated blocks. They write coordinate points to identify the placement of their stickers.
Curated OER
Graphing Linear Equations Using Data Tables
Pupils review the Cartesian plane and the process of plotting points. In groups, students create tables, identify the slope and y-intercept, and graph the equation. Afterward, pupils perform the same process, only, individually. As a...
Curated OER
A Christmas Project
Seventh graders publish a letter and spreadsheet using the computer. They build a three-dimesnsional object with construction paper and develop a Christmas object using coordinates on a graph. Students compose a response in their journals.
Curated OER
Parabolas
In this parabolas worksheet, 11th graders solve and complete 12 different problems. First, they use the graph to write the equation of each parabola. Then, students name the vertex for each and write their responses on the line provided.
Virginia Department of Education
Translation and Reflection
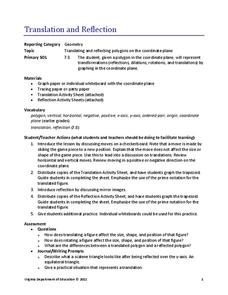
Bring about the change you want to see in the world or at least in your lesson plans. Young mathematicians learn about translation and reflections by applying them to polygons on the coordinate plane. Results provide data to develop...
Virginia Department of Education
Rotation
Rotate this resource into your lesson plans. Scholars rotate polygons in the coordinate plane by multiples of 90 degrees. They then compare the original and new figures to develop conjectures about coordinate points after rotations.
School Mathematics Project
Resource Sheets
This extensive and far-reaching collection of worksheets puts a new twist on many basic concepts. Learners use multiplication to trace a path from one point to another, tile a plane by converting between improper and proper fractions,...
Curated OER
Comparing Costs
Students compare the costs of two cellular phone plans and determine the best rate. They use a table and a graph of points plotted on a Cartesian plane to display their findings. Students write an equation containing variables that could...
Curated OER
Cartesian Coordinates
Students investigate rational numbers through data analysis and statistics. In this algebra instructional activity, students represent, rename, compare and order rational numbers. They collect and represent data correctly on a graph.
Curated OER
Functions
In this functions worksheet, students solve and complete 11 different types of problems. First, they find the coordinates of all points on the graph of each equation where the tangents to the graph are horizontal. Then, students write...
Curated OER
Walking the Plank: Student Worksheet
In this math worksheet, students will work in a group to experiment with the weight of objects when placed at a distance from a scale (using a plank). Students will record and graph their results.
Curated OER
Investigating Parabolas
In this investigating parabolas worksheet, 9th graders solve and graph 7 different problems that include graphing various equations that represent parabolas. First, they sketch their graphs to each problem. Then, students determine what...


