Curated OER
Wiggle Worms
First graders investigate worms, collect and analyze data. In this worm and data lesson, 1st graders listen to Chick and Duckling from the Macmillan/McGraw-Hill reading series. They conduct experiments with worms, collect simple data,...
Curated OER
Favorite Days
Students collect and organize data about themselves. In this data analysis lesson, students discuss their favorite calendar dates and explore ways to display the data.
Curated OER
The Solar Cycle
Students research the solar cycle. In this Science lesson, students use the internet to investigate the solar cycle. Students produce a spreadsheet and graph from the information collected.
Curated OER
200 Years and Counting: How the U.S. Census Tracks Social Trends
Students examine the process of census taking in the United States. For this "200 Years and Counting" lesson, students examine the data collection process, look at an example of a census form, analyze data, and learn what the information...
Curated OER
Reading the Neighborhood
First graders complete activities with the story One Monday Morning in the Macmillan/McGraw Hill Textbook. In this data lesson, 1st graders read the story and gather data to create a picture graph. They read the graph and answer...
Curated OER
Adopt a City-Winter Weather
In weather worksheet, students use an on line site to collect weather data. They create 10 different weather scenarios using a temperature and humidity slider. They includethe temperature, relative humidity and weather conditions and...
Curated OER
Fractile vs. Equal
Students compare and contrast methods of categorizing data. In this data collection lesson, students complete worksheet activities that require them to note the differences between equal and fractile intervals. Students also discuss...
Curated OER
Beans and Birds: A Natural Selection Simulation
Young scholars solve the following problem concerning the evolution of seed color in pinto bean plants: "How does natural selection change the frequency of genes or traits over many generations?" They use the constructivist approach to...
Curated OER
Cyber Chow Combos
Students, after watching the CYBERCHASE episode, "A Day at the Spa,"represent and count combinations of choices using tree diagrams.
Curated OER
Biospheres in Your Backyard
Students collect data from a local river biome. They use the information for metric conversion and graphing equations. They study the components of what makes up a biosphere and how math is used to analyze one.
Curated OER
Numeracy Practice- Going Out For Lunch
In this math learning exercise, learners complete the various types of activities that include graphs, data tables, and completing number sentences.
Curated OER
Handling Data- Health Statistics
In this social studies worksheet, students organize 50 country cards into groups. Students analyze a chart and group countries according to lowest, middle, and highest Infant Mortality Rate.
Curated OER
Speed and Experiments
In this speed formula and scientific method worksheet, students read over descriptions of the formula an method. Students then respond to 12 matching, problem solving and short answer questions.
Curated OER
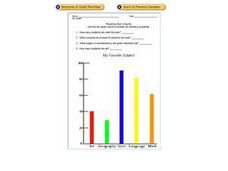
Reading Bar Graphs: My Favorite Subject
In this bar graphs worksheet, learners analyze a bar graph about favorite school subjects. Students use the information on the graph to answer 7 questions.
Inside Mathematics
Snakes
Get a line on the snakes. The assessment task requires the class to determine the species of unknown snakes based upon collected data. Individuals analyze two scatter plots and determine the most likely species for five additional data...
Radford University
Sleep and Teen Obesity: Is there a Correlation?
Does the number of calories you eat affect the total time you sleep? Young mathematicians tackle this question by collecting their own data and making comparisons between others in the class through building scatter plots and regression...
Illustrative Mathematics
How Many Buttons?
Bring the class into the probability by having everyone count buttons on their shirts. Organize the data into the chart provided and chose different possibilities such as "female with one button" or "all students with more than four...
Howard County Schools
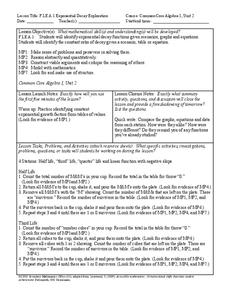
Exponential Decay Exploration
How can you model exponential decay? Explore different situations involving exponential decay functions and decreasing linear functions by performing activities with MandM candy, popcorn kernels, and number cubes.
Chicago Botanic Garden
Historical Climate Cycles
Scientists use ice core samples to obtain temperatures of the earth from 400,000 years ago! The third of five lessons instructs pupils to interpret historical climate data to see changes over time. In part I, participants interpret...
Inside Mathematics
House Prices
Mortgages, payments, and wages correlate with each other. The short assessment presents scatter plots for young mathematicians to interpret. Class members interpret the scatter plots of price versus payment and wage versus payment for...
Bowland
Mystery Tours – Plan Your Tour
Everyone loves a vacation and a set of three activities has groups planning a tour of the U.K. using given distance, time, and price data. They solve a variety of problems related to the trip and produce a report on the success of the trip.
CK-12 Foundation
Understand and Create Histograms: Histograms
Tally ho! Represent the frequency of ages at school. Pupils finish a tally chart to match the frequencies of ages at school. Using the frequencies, the learners create a histogram. With the aid of the histogram and the frequency table,...
Annenberg Foundation
Skeeters Are Overrunning the World
Skeeters are used to model linear and exponential population growth in a wonderfully organized lesson plan including teachers' and students' notes, an assignment, graphs, tables, and equations. Filled with constant deep-reaching...
Serendip
How Do We Sense the Flavors of Food?
We taste with our taste buds, so why do flavors change when we have a stuffy nose? Scholars experiment with taste testing while holding their noses and then while smelling. They record their observations in pairs and come together to...


