Illustrative Mathematics
Function Rules
Function machines are a great way to introduce the topic of functions to your class. Here, you will explore the input and output to functions both using numerical and non-numerical data. Learners are encouraged to play with different...
Mathed Up!
Frequency Polygons
Frequency polygons are a different way to represent frequencies over intervals. Pupils take frequencies for intervals of data from a frequency table and plot them as a frequency polygon. Budding mathematicians find information about the...
Virginia Department of Education
Work and Power
Assist your class with correctly calculating the values for force, work, and power as they determine the amount various activities require. They gather data and participate in a group discussion to compare results upon conclusion of the...
NASA
Newton Car
If a car gets heavier, it goes farther? By running an activity several times, teams experience Newton's Second Law of Motion. The teams vary the amount of weight they catapult off a wooden block car and record the distance the car...
EngageNY
Comparing Linear and Exponential Models Again
Making connections between a function, table, graph, and context is an essential skill in mathematics. Focused on comparing linear and exponential relationships in all these aspects, this resource equips pupils to recognize and interpret...
Illustrative Mathematics
Modeling London's Population
Looking at London's population from 1801–1961 in 20 year increments, high school mathematicians determine if the data can be modeled by a given logistic growth equation. They explain their thinking and determine the values of each...
Illustrative Mathematics
Invertible or Not?
Two for one—create an invertible and non-invertible function from the same data. The task presents a function table with missing outputs for the class to use to create two functions. One of the functions should have an inverse while the...
Space Awareness
Oceans as a Heat Reservoir
Oceans absorb half of the carbon dioxide and 80 percent of the greenhouse gases released into the atmosphere. Scholars learn how and why the oceans store heat more effectively than land and how they help mitigate global warming. Pupils...
Towson University
Case of the Crown Jewels
Can your biology class crack the Case of the Crown Jewels? Junior forensics experts try their hands at DNA restriction analysis in an exciting lab activity. The lesson introduces the concept of restriction analysis, teaches pipetting and...
Virginia Department of Education
Heat and Thermal Energy Transfer
How does radiation affect our daily lives? Answer that question and others with a lesson that discusses radiation and its use in thermal energy transfer through electromagnetic waves. Pupils investigate vaporization and evaporation while...
Mathed Up!
Scatter Graphs
Make an estimate by getting in line. The class works with scatter plots and lines of best fit to make an estimate for given values. Pupils determine whether there is a positive or negative correlation and draw a best-fit line. Using the...
CK-12 Foundation
Frequency Polygons: Constructing a Frequency Polygon
Connect the dots on frequency. Given a distribution table of scores on an assessment, learners create a frequency polygon by moving points on a graph to the correct frequency. The pupils use the display to answer questions about the...
Mathed Up!
Tallys and Charts
After watching a brief instructional video, young mathematicians are put to the test. By completing and reading frequency tables, tally charts, and bar graphs, individuals show their understanding of how to interpret data.
Savvas Learning
Saxon Math 5/4
You'll never have to search for another worksheet again after downloading this extensive collection of Saxon math materials. With over 600 pages of example problems and skills practice exercises, this is a must-have resource for any...
Serendip
Understanding and Predicting Changes in Population Size – Exponential and Logistic Population Growth Models vs. Complex Reality
Salmonella poisoning impacts over 200,000 people in the United States each year. Scholars learn about the growth of these bacteria using multiple approaches. Then they apply the same growth calculations to endangered species and think...
Achieve
Yogurt Packaging
Food companies understand how to use math to their advantage. Learners explore the math related to the packaging and serving size of yogurt. They then use unit analysis and percent values to make decisions on the product development.
Curated OER
Reflection and Refraction
Life is only a reflection of what we allow ourselves to see. The lesson includes three experiments on light reflection, light refraction, projection, lenses, and optical systems. Each experiment builds off the ones before and encourages...
EngageNY
Probability Rules (part 1)
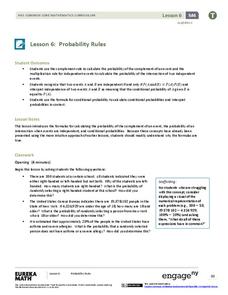
In statistics, probability rules—literally! Learners use their previous knowledge and explore a set of rules for conditional probability, independent probability, and complements. Given different scenarios, they must determine what type...
Water
Global Water Supply High School Curriculum
Some areas of the world take water for granted while others are in crisis. So what to do? Learners consider the water crisis situation in several countries. They compare and contrast each location and the causes and effects of the water...
DiscoverE
Aviary Architect
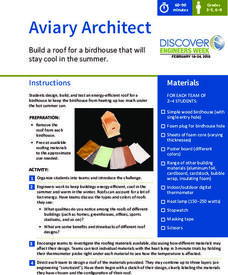
Groups of two to four work collaboratively to engineer a birdhouse that will stay cool in the summer heat. Teams examine several different-colored roofs, testing the efficiency of each with a heat lamp. Then, groups sketch their ideas,...
Curated OER
The Demographics of Immigration: Using United States Census Data
Students work together to analyze United States Census data on immigration. They compare and contrast the data and determine how immigration numbers have changed over time. They calculate percentages and make their own conclusions...
Curated OER
Frequency Histograms, Bar Graphs and Tables
In this statistics worksheet, students graph their data using frequency histograms, bar graphs and tables. They decide which graph shows the data best. There are 6 graphing problems.
Curated OER
Using Matrices for Data
For this matrices for data worksheet, 9th graders solve and complete 29 various types of problems that include using matrices to illustrate data. First, they determine the sum, difference and scalar product for each matrices shown. Then,...
Curated OER
Observations (collecting data)
Students observe and collect data about the earthworm. In this observation of an earthworm lesson plan, students use an earthworm to determine the effects of light and incline on the earthworm's behavior. They practice making...


