Personal Genetics Education Project
Scientific Themes in Personal Genetics
Humans can be tested for the presence of the BRCA gene, whose presence is an indicator that they have a greater chance of acquiring breast cancer than someone without the gene. Viewers have an opportunity to explore how genes and...
Inside Mathematics
Graphs (2006)
When told to describe a line, do your pupils list its color, length, and which side is high or low? Use a worksheet that engages scholars to properly label line graphs. It then requests two applied reasoning answers.
Inside Mathematics
Rugs
The class braids irrational numbers, Pythagoras, and perimeter together. The mini-assessment requires scholars to use irrational numbers and the Pythagorean Theorem to find perimeters of rugs. The rugs are rectangular, triangular,...
UAF Geophysical Institute
Carbon Footprint
Your young environmentalists can calculate their carbon footprint and discuss ways to reduce it with a worksheet about climate change. After reading a handout about what impact one's carbon footprint can have on the environment, kids...
UAF Geophysical Institute
System Interactions: The Lorax and the Truffula Tree
If the Lorax were to write a letter, what would he write? Introduce your class to systems and feedback loops through the whimsical stylings of Dr. Seuss. Learners take on the Lorax's point of view to write a letter, among other activities.
University of Texas
Matter and the Periodic Table Chemical Families and Periodic Trends
Is assembling the periodic table as simple as Tetris? Scholars arrange colored cards into a logical order and then make connections to the arrangement of the periodic table. Hands-on activities include adding trend arrows and analyzing...
Curated OER
Math On the Job
Investigate different types of math required for specific jobs. In this math in occupations activity, use the Internet to research what type of math one might need to know in order to be successful in different jobs. Complete a related...
Inside Mathematics
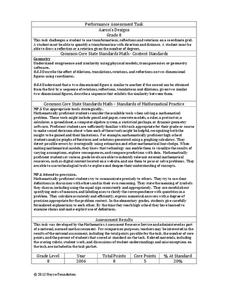
Aaron's Designs
Working with transformations allows the class to take a turn for the better. The short assessment has class members perform transformations on the coordinate plane. The translations, reflections, and rotations create pattern designs on...
Achieve
Ground Beef
Ever wonder how a butcher creates the different types of ground beef? Young mathematicians explore the methods butchers use to create their desired ground beef quality. Given a combination of two types of meat with varying leanness,...
Inside Mathematics
Hopewell Geometry
The Hopewell people of the central Ohio Valley used right triangles in the construction of earthworks. Pupils use the Pythagorean Theorem to determine missing dimensions of right triangles used by the Hopewell people. The assessment task...
Columbus City Schools
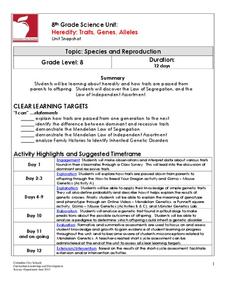
Heredity: Traits, Genes, Alleles
If you knew people would pay extra for a bald dragon, could you pick which parents you should breed in order to get the highest number? The unit examines heredity and genetics through breeding dragons, mice, dogs, and tries to figure...
Herff Jones Education
Reaction Rates
Equip pupils with tools to determine reaction rates as they explore conditions that cause a reaction to increase or decrease. They also discuss why this occurs and predict the next steps as they take part in a series of experiments.
Kenan Fellows
Effects of a Golf Course on Stream Health
Is the golf course causing issues in the stream? Find out with a resource that has groups perform chemical water tests to analyze the effects of a golf course on a stream. Pupils collect water above and below the course and analyze the...
Cornell University
Glued into Science—Classifying Polymers
Explore the unique characteristics of polymers. A complete lesson begins with a presentation introducing polymers. Following the presentation, young scientists develop a laboratory plan for creating substances using polymers. They test...
Virginia Department of Education
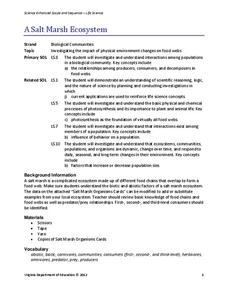
A Salt Marsh Ecosystem
What a web we weave. Pupils use yarn as the primary resource to create a web depicting the intricacies of a salt marsh ecosystem. They participate in a question and answer session, which leads to an in-depth facilitated discussion about...
Space Awareness
Let's Break the Particles
Build learning by breaking atoms! Young scientists study the way energy changes with a hands-on activity. As they roll steel marbles down a ramp, learners test the hypothesis that kinetic energy does not go away with friction or...
Curated OER
Predicting Monthly Precipitation
Students should log onto, and collect data from, a specific site on the Internet. They average and compare the data using the Excel spreadsheet program, make predictions from their data, and determine the percent error of their predictions.
Curated OER
Statistics and Probility
Seventh graders collect data and make predictions. In this geometry instructional activity, 7th graders work in tiers collecting data and plotting it. They make inferences and predictions about their collected data.
Curated OER
Count Down
Students are introduced to useing websites as a data source. Using bird population predictions, they test their predictions from various websites. They record, organize and graph the data and share their results with the class.
Curated OER
Statistics and Shopping
Students examine statistics and data analysis concepts from the practical questions that arise in everyday life.
Curated OER
Growing Up With A Mission
Student measure heights and graph them using growth charts for which they find the mean, mode, and median of the data set. They graph points on a Cartesian coordinate system.
Curated OER
Drops on a Penny
Eighth graders experiment to determine the number of drops of water a heads up penny hold. They create a stem and leaf graph of the class results and use the data for further experimentation on a tails up penny.
Curated OER
Snow Cover By Latitude
Students examine computerized data maps in order to create graphs of the amount of snowfall found at certain latitudes by date. Then they compare the graphs and the data they represent. Students present an analysis of the graphs.
Curated OER
Awesome Animals
Students collect data from classmates about their favorite animal. They use the ClarisWorks graphing program to enter data, graph results, and interpret data.


