Curated OER
CORNER CABINET
Ninth and tenth graders calculate the length, width, height, perimeter, area, volume, surface area, angle measures or sums of angle measures of common geometric figures. They solve problems involving scale drawings, models, maps or...
Achieve
Rabbit Food
Keep your pets slim, trim, and healthy using mathematics! Pupils use a linear programming model to optimize the amount and type of food to provide to a pet rabbit. They model constraints by graphing inequalities and use them to analyze a...
Georgia Department of Education
Math Class
Young analysts use real (provided) data from a class's test scores to practice using statistical tools. Not only do learners calculate measures of center and spread (including mean, median, deviation, and IQ range), but also use this...
Teach Engineering
Building a Barometer
Forget your local meteorologist — build your own barometer and keep track of the weather with an activity that provides directions to build a barometer out of a narrow necked bottle, a glass, and some water. Using their barometer, teams...
National Nanotechnology Infrastructure Network
Scale Models
With instructions to adapt the activities for any grade K-12, any teacher can incorporate the concept of scale into the classroom with a simple, yet effective lesson.
Curated OER
Angles
Learners identify obtuse and acute angles in comparsion to a right angle. They identify obtuse, acute, and right angles. Pupils use "Shape Measure" to construct obtuse, acute, and right angles. They review line segements to locate right...
LABScI
Cell Diffusion and Permeability: The See-Thru Egg Lab
Create a model to study a microscopic phenomenon. The seventh of 12 lessons uses an egg (without its shell) to represent a cell membrane. Using different solutions, learners explore the concept of cell diffusion. They monitor...
American Statistical Association
EllipSeeIt: Visualizing Strength and Direction of Correlation
Seeing is believing. Given several bivariate data sets, learners make scatter plots using the online SeeIt program to visualize the correlation. To get a more complete picture of the topic, they research their own data set and perform an...
EngageNY
Cyclic Quadrilaterals
What does it mean for a quadrilateral to be cyclic? Mathematicians first learn what it means for a quadrilateral to be cyclic. They then investigate angle measures and area in such a quadrilateral.
Institute of Electrical and Electronics Engineers
A Question of Balance
It's a neat idea, but the task of designing a system for filling jars with consistent specific amounts of a product may be a little out of reach, especially for younger pupils. Intended as an engineering design lesson, this may be better...
Curriculum Corner
8th Grade Math "I Can" Statement Posters
Clarify the Common Core standards for your eighth grade mathematicians with this series of classroom displays. By rewriting each standard as an achievable "I can" statement, these posters give students clear goals to work toward...
Statistics Education Web
Consuming Cola
Caffeine affects your heart rate — or does it? Learners study experimental design while conducting their own experiment. They collect heart rate data after drinking a caffeinated beverage, create a box plot, and draw conclusions. They...
Curriculum Corner
8th Grade Math Common Core Checklist
Ensure your eighth graders get the most out of their math education with this series of Common Core checklists. Rewriting each standard as an "I can" statement, this resource helps teachers keep a record of when each standard was taught,...
EngageNY
Estimating Probability Distributions Empirically 2
Develop probability distributions from simulations. Young mathematicians use simulations to collect data. They use the data to draw graphs of probability distributions for the random variable in question.
Cornell University
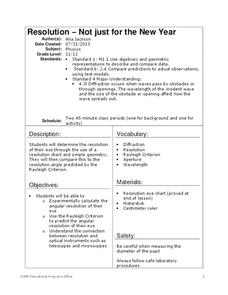
Resolution—Not Just for the New Year
Experiment with optical resolution using an inquiry-based lesson. Young researchers calculate fellow classmates' optical resolutions. They apply the information to understand the inner workings of optical instruments.
Achieve
Ground Beef
Ever wonder how a butcher creates the different types of ground beef? Young mathematicians explore the methods butchers use to create their desired ground beef quality. Given a combination of two types of meat with varying leanness,...
Massachusetts Department of Education
Similarity through Transformations
Create the ultimate miniature golf course. The 93-page model curriculum unit from the Massachusetts Department of Elementary and Secondary Education contains nine lessons on understanding similarity in terms of both Euclidean geometry...
Virginia Department of Education
Attributes of a Rectangular Prism
A change is coming. Pupils use unit cubes to investigate how changes in the length, width, and/or height affects volume and surface area. They extend the results to write and test predictions on the effect of changing multiple sides on...
Partnership for Educating Colorado Students
Mayan Mathematics and Architecture
Take young scholars on a trip through history with this unit on the mathematics and architecture of the Mayan civilization. Starting with a introduction to their base twenty number system and the symbols they used, this eight-lesson unit...
West Contra Costa Unified School District
Pythagorean Theorem and Its Converse
Challenge scholars to prove the Pythagorean Theorem geometrically by using a cut-and-paste activity. They then must solve for the missing sides of right triangles.
Newspaper Association of America
Cereal Bowl Science and Other Investigations with the Newspaper
What do cereal, fog, and space shuttles have to do with newspapers? A collection of science investigations encourage critical thinking using connections to the various parts of the newspaper. Activities range from building origami seed...
University of California
The Cold War (America)
The Cold War—with its roots in World War II—impacts the world today. Using an extensive curriculum, scholars consider its impact through primary sources, including speeches and propaganda, as well as other skills-enhancing activities. An...
Shodor Education Foundation
Stem and Leaf Plotter
The key is in the leaves. Pupils enter data to create a stem-and-leaf plot. The resource then displays the plot and calculates the mean, median, and mode of the data. Using the plot and the calculated measures of spread, learners analyze...
Missouri Department of Elementary
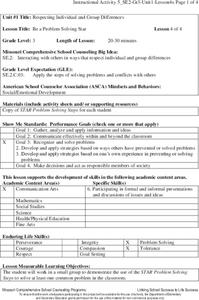
Be a Problem Solving Star
Reach for the STARs! Using the resource, scholars review the STAR (Stop, Think, Act, Review) method and discuss how to use it to solve a math equation. Next, small groups collaborate to solve a common problem in the classroom using the...


