Curated OER
Using Your Melon for Math
Students apply fraction multiplication and division to recipe conversion.
Curated OER
Using Standard Units
In this standard units worksheet, students problem solve 11 questions by answering with 1 of the following standard units: meters, centimeters, millimeters, grams, kilometers and/or kilograms.
Curated OER
Diurnal Temperature Changes and Water Vapor Content
Students determine how much moisture in the air affects the diurnal temperature range. They investigate to determine the different climatological regimes of both the Southern Plains and the world. and greenhouse gases effect the earth's...
Curated OER
Order of Operations
Ninth graders investigate the order of operations. In this Algebra I lesson, 9th graders explore the rules of arithmetic and algebra as they review and practice simplifying increasingly complex numeric expressions using the order of...
Curated OER
Get On Board
Students create a ticket table illustrating the cost of tickets by alternative transportation. In this number sense lesson, students write number sentences to compare and contrast difference information in their chart. Students figure...
Curated OER
Recording Frequency
First graders analyze nursery rhymes and gather data about word frequency. In this frequency lesson, 1st graders create graphs and tables. Students interpret the data.
Curated OER
Why Standard Units?
A variety of units of measurement are taught in this math worksheet. First, students measure objects using their hands. Then, they use a ruler to gain more precise measurements in meters and centimeters. Nice worksheet!
Curated OER
Comparing Data on Graph A and Graph B
Second graders gather and graph data. In this graphing lesson plan, 2nd graders collect data and graph this information using tally charts, bar graphs, pictographs, or tables. They make predictions about the outcomes.
Pennsylvania Department of Education
Volume of Regular and Irregular Objects
Fifth graders examine patterns and relate to equations to solve math problems. In this patterns lesson, 5th graders diagram, graph, use models and use tables to solve equations for real world problems.
Curated OER
Probabilities for Number Cubes
Learners explore the concept of probability. In this probability lesson, students roll a six-sided number cube and record the frequency of each outcome. Learners graph their data using a frequency chart and keep tally marks in a...
Curated OER
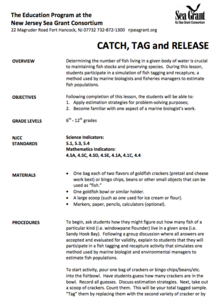
Catch, Tag, and Release
Learners discover how fish tagging is used by marine biologists and fisheries to estimate fish populations. Participating in a simulation, learners use estimation to determine the whole population from a small number of items.
Curated OER
Science Safety is Elementary
Third graders are introduced to the importance of science safety. As a class, they role play through different safety procedures and decide which senses need to be protected for different scenerios. They discuss how to avoid hazardous...
Curated OER
Arthropod Life Cycle
In this arthropod life cycle worksheet, students will use a diagram showing the 4 stages of butterfly metamorphosis to complete a table describing each of the stages.
Curated OER
Habitat Art: Florida Panthers
Students discover the lifestyles of a Florida Panther by investigating its habitat. In this wild animal instructional activity, students utilize the Internet to research the habits of a Panther and what their habitat is. Students...
Curated OER
Graphing the Forecast-Line Graph or Bar Graph?
Learners explore bar and line graphs. In this data collection, graphing, and weather lesson, students compare bar and line graphs and discuss which type of graph would be most appropriate for displaying a ten day weather forecast....
Curated OER
Math in Science-Radioactive Decay and Half-Life
In this radioactive decay and half-life worksheet, learners use given half-lifes to calculate the amount of time it will take for certain amounts of elements to decay. They also find the age of samples and determine how many grams of...
Curated OER
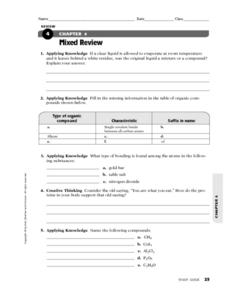
Mixed Review
In this chemistry worksheet, students solve chemical equations and define terminology using previous knowledge. There are 8 review questions.
Curated OER
Comparing Data
Eighth graders create a survey, gather data and describe the data using measures of central tendency (mean, median and mode) and spread (range, quartiles, and interquartile range). Students use these measures to interpret, compare and...
Curated OER
Groundwater
In this groundwater worksheet, students use 12 given terms and match them to their definitions related to characteristics of groundwater and the components of the ground where the water travels. Students also fill in 5 blanks with given...
Scholastic
Make a Mini Mayflower
Students discover the importance and history behind the Thanksgiving feast. Using walnut shells and toothpicks, they construct models of the Mayflower and simulate giving them to the Native Americans for helping the Pilgrims survive.
Curated OER
Making a Line Graph
In this line graph worksheet, students use data given in a table and assign axes, make a scale, plot data and make a line or curve on their constructed graphs.
Curated OER
Square Numbers
In this squaring numbers activity, learners use a hundred chart to shade in the answer to squared numbers. Students begin with 1 x 1 and shade in the answer. Learners then continue with 2 x 2 and shade that answer, going all the way to...
Curated OER
How Do You Know A Panther Was Here?
Students research the signs that panthers leave. In this panther track activity, students conduct Internet research into the signs that panthers leave such as tracks, scat, scrapes, and scratches. They make a three-dimensional poster...
Curated OER
Graph it!
Sixth graders view a Stacked Graph, and discuss what it shows. Students discuss the basics of graphing: labels, intervals, legends x and y axis... Students create individual stacked graphs from provided information. Students view a...


