Curated OER
Weather and Climate Around the World
Learners explain the difference between climate and weather. They gain concepts of currents and discuss how the currents have an affect on climate and weather. Students gain knowledge of the instruments that meteorologists use to predict...
National Wildlife Federation
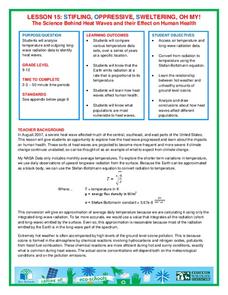
Stifling, Oppressive, Sweltering, Oh My!
Looking for a hot date? Pick any day in August, statistically the hottest month in the United States. The 15th lesson in the series of 21 instructs pupils to investigate the August 2007 heat wave through NASA data, daily temperature...
National Wildlife Federation
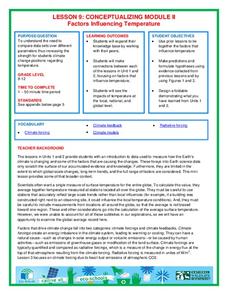
Conceptualizing Module II - Putting It All Together
"Creativity is just connecting things." - Steve Jobs. After weeks of researching climate change, the ninth lesson in a series of 21 combines the data and analysis to address essential questions. It covers natural phenomenon, human...
National Wildlife Federation
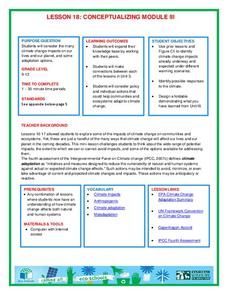
Conceptualizing Module III
Many researchers focus on one impact of climate change in isolation, but researchers gain a global perspective when they come together. A timely instructional activity teaches scholars about the projected impacts of global temperature...
National Wildlife Federation
Citizen Science to the Rescue!
You don't have to be a scientist or even out of high school to contribute to scientific research. In the 12th lesson in the series of 21, scholars use this opportunity to add to the growing body of scientific knowledge and consider the...
National Wildlife Federation
The Tide is High, but I’m Holding On… Using ICESat Data to Investigate Sea Level Rise
Based on the rate of melting observed from 2003-2007 in Greenland, it would take less than 10 minutes to fill the Dallas Cowboys' Stadium. The 17th lesson in a series of 21 has scholars use the ICESat data to understand the ice mass...
Curated OER
Going Local with Global Warming
Students examine climate change by using recent temperature records. In this data analysis lesson students plot weather data and study the differences between weather and climate.
Curated OER
Exploring Seasons
Students study the four seasons. They determine changes that occur in our environment. They demonstrate an understanding of the basic features of Canada's landscape and climate and identify the basic weather and climate patterns of...
Curated OER
The Atmosphere
Here is a suitable set of slides to use when teaching about the layers of the atmosphere, climate, global winds, and types of clouds. These slides will support a few different lectures. You will probably want to replace the diagrams with...
Curated OER
Is Grandpa Right, Were Winters Colder When He Was a Boy?
Students compare current weather data to historic data to see if there is a temperature change. In this weather lesson students complete a lab activity and determine average changes in temperature, precipitation and cloud cover.
Curated OER
Is Portland, Oregon Experiencing Global Warming?
Students use data to determine if the climate in Portland has changed over the years. In this weather lesson students complete line graphs and study long wave radiation.
PBS
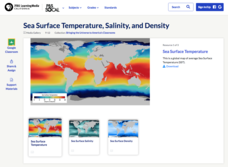
Sea Surface Temperature, Salinity, and Density
Earth's vast ocean is full of mysteries! Science scholars discover the big-picture properties that influence its characteristics at different latitudes using a lesson plan from PBS's Weather and Climate series. After completing a...
Curated OER
History's Thermometers
Ancient coral beds give scientists clues to past ocean temperatures in much the same way that tree rings indicate historical weather conditions. High school scientists examine coral oxygen isotope ratios and plot the data as a function...
Curated OER
Feeling the Heat
Pupils record temperatures at different locations around campus. They examine the results and draw conclusions about how materials and colors affect the amount of heat produced. They also analyze Los Angeles' temperature records over a...
PBS
Rain Shadows
Satellite images from NASA help scholars focus on the similarities on the planet rather than the differences. The photos from the installment of a larger PBS series exploring weather and climate compare geological formations in the...
Curated OER
Comparing Climates - Three Ring Venn Diagram
In this Venn diagram worksheet, students read about the use of the graphic organizer to make comparisons. They compare three different climate types in the three rings of the diagram.
Curated OER
The Day After Tomorrow: How is the Density of Water Related to Climate Change and Global Warming?
Science learners simulate what happens when ice breaks up and floats on water and how increased pressure on ice causes it to melt faster. They view a clip from the movie, The Day After Tomorrow, and relate their lab activities to what...
Curated OER
Is Climate Change Really Happening?
Young scholars explore the impact of global warming. In this oceanography lesson, students investigate global climate change and write reaction papers about their research findings.
Weather Vocabulary Quiz + The Water Cycle
Quiz on Weather vocabulary (equator, northern and southern hemisphere, moisture, temperature, climate, axis, predictable) and the Water Cycle
Curated OER
Regents High School Examination: Physical Setting Earth Science 2009
Junior geologists address 50 multiple choice questions and 35 short answer questions about the earth system. Plenty of visuals are included for interpretation: diagrams, graphs, maps, photographs, laboratory setups, weather symbols, and...
Curated OER
The Prairie Climate
Ninth graders research the average temperature and precipitation of a prairie region to determine the type of climate it is, and how it differs from other biomes. They examine the types of adaptions animals have made to live in the...
Curated OER
Worksheet 3: Earth's Climate System II
A diagram of a mountain range and the prevailing winds is shown at the top of the page. Meteorology pupils describe the weather conditions at different points on the diagram. They explain the El Nino effect and why evaporation and...
Radford University
A Change in the Weather
Explore the power of mathematics through this two-week statistics unit. Pupils learn about several climate-related issues and complete surveys that communicate their perceptions. They graph both univariate and bivariate data and use...
Living Rainforest
Finding the Rainforests
From Brazil to Indonesia, young scientists investigate the geography and climate of the world's tropical rain forests with this collection of worksheets.
Other popular searches
- Atmosphere Climate Weather
- Climate and Weather
- Weather and Climate Lessons
- Weather and Climate Change
- Weather and Climate Compare
- Climate Weather Patterns
- Space Weather and Climate
- Weather and Climate Patterns
- Climate and Weather Quiz
- Climate and Weather Test
- Water, Weather and Climate
- Weather Climate Statistics


