Chicago Botanic Garden
Historical Climate Cycles
Ice core samples give scientists access to climates of old—those from more than 800,000 years ago. Through an analysis of various temperature graphs from ice cores, tree rings, and weather stations, scholars compare historical climates...
Curated OER
Tracking Local Weather
In this activity, studens will use different types of weather gauges and track the local weather for a week. After the week is over, students will collect their samples, analyze the data, and compare their conclusions to local weather...
US Environmental Protection Agency
Tree Rings: Living Records of Climate
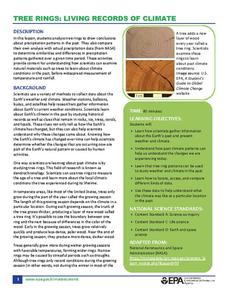
Open with a discussion on weather and climate and then explain how tree rings can provide scientists with information about the earth's past climate. Pupils analyze graphics of simulated tree rings from various US locations for the...
Curated OER
What Goes Up Must Come Down!!
Fifth graders look at actual sunrise and sunset times for their hometown to determine a pattern in the amount of daylight. They collect their data in Excel and create a chart to help them identify the pattern, then write an explanation...
Curated OER
Feeling the Heat
Pupils record temperatures at different locations around campus. They examine the results and draw conclusions about how materials and colors affect the amount of heat produced. They also analyze Los Angeles' temperature records over a...
NOAA
El Niño
El Nino, La Nina ... and the Santa Maria? The 11th installment of a 23-part NOAA Enrichment in Marine sciences and Oceanography (NEMO) program explains the mechanism of El Nino/Southern Oscillation. Pupils use previous data to determine...
EngageNY
Relationships Between Two Numerical Variables
Is there another way to view whether the data is linear or not? Class members work alone and in pairs to create scatter plots in order to determine whether there is a linear pattern or not. The exit ticket provides a quick way to...
Curated OER
Dripping Wet or Dry as a Bone?
Students use a sponge and water model to explore the concept of relative humidity and create a percent scale. They define humidity and saturation, build a simple humidity/saturation model, collect, predict and interpret data, and create...
Curated OER
Weather Conditions During the Fall Monarch Migration
Students keep detailed weather records during the fall migration of the monarch butterfly. They compare weather conditions to the days they do and do not see monarchs. As a class, they graph and analyze data and send it to a university...
Curated OER
Measuring Wind Speed
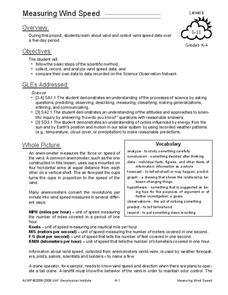
Students study wind speed and collect wind speed data. In this wind speed lesson, students visit a website to learn about the local wind speed forecast for their week. Students discuss wind and wind speed. Students collect wind speed...
Curated OER
Chart the Weather for Cities Around the World
Students orally describe Northern and Southern hemispheres, identify 7 continents, and point out specific countries and cities. They locate and record weather information.
Curated OER
Using Imported Data in Excel
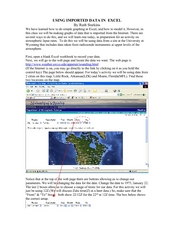
Students import atmospheric data from the internet. In this earth science activity, students graph the data they collected. They complete the worksheet after the activity.
Curated OER
Climate Change in My City
High schoolers investigate the climate changes occurring locally, regionally and globally over the last one hundred years. They brainstorm and predict whether the current year's weather was warmer or colder than last year then check the...
Teach Engineering
Pointing at Maximum Power for PV
Following detailed directions, teams collect the voltage and current outputs of a photovoltaic cell by adjusting the resistance. Using the collected data, they determine the highest power output. Implications for weather and a large...
Curated OER
Excel temperature Graphs
Learners gather data about the weather in Nome, Alaska. In this Nome Temperature lesson plan, students create an excel graph to explore the weather trends in Nome. Learners will find the average weather and add a trend line to...
Pulitzer Center
The Global Water Crisis
High schoolers examine the "quiet crisis," the lack of clean water, by reading articles and viewing video clips. They discuss the situations in Ethiopia, Yemen, Kenya, and Nepal. There are two options for the lesson, but one of them...
Curated OER
EarthTrek Gravestone Project
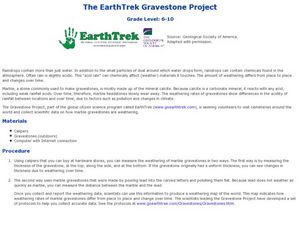
Students explore the effects of acid rain. In this acid rain lesson, students investigate the effects of the weathering from acid rain in different places. Students visit cemetaries to collect data about the effects of acid rain on the...
Curated OER
Natural Selection
Kids act as scientists and preditors in this short natural selection activity; they collect and analyze data, then apply their new knowledge to real-world examples of natural selection. The layout of the worksheet is easy enough to use...
Curated OER
Scatter Plots
Seventh graders investigate how to make and set up a scatter plot. In this statistics lesson, 7th graders collect data and plot it. They analyze their data and discuss their results.
Curated OER
Forecast Fever
Ninth graders investigate what high-tech tools are used to gather weather data and make weather forecasts. They view a video and a PowerPoint presentation, and conduct research on a cloud chart website. Students make local weather...
Curated OER
Graph and Compare the Adventure's Temperature Vs. Local Temperature
Students explore the concept graphing data. In this graphing data lesson, students use weather data from their local weather and some other city and graph them. Students plot the local weather vs. another city. Students record...
Curated OER
Clouds and the Weather
Fourth graders analyze the relationship of clouds and local weather. Students also observe and record cloud data and weather conditions daily as they research different cloud types. The data is analyzed looking for trends in daily...
Curated OER
Agriculture, Weather, Economy and Indiana
Fourth graders, in groups, investigate the role of weather in Indiana's farming economy. They make a prediction as to weather and its effect on the economy of Indiana. They present their data using a media presentation of data...


