Curated OER
TV Survey - Data Collection and Analysis
In this data collection and analysis worksheet, 4th graders complete a tally chart about the number of hours that fourth graders watch television. They create a bar graph with the information, write a paragraph about the survey results,...
Curated OER
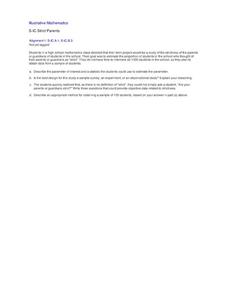
Strict Parents
Are your parents or guardians strict? That's an interesting question many of your pupils are probably interested in discussing. How do you design a study directed at your high schooler to gain insight into that question? How do you...
Curated OER
Surveys and Samples
In this surveys and samples worksheet, students discover data collection techniques and write their own survey questions. Students use random sampling, convenience sampling, and systemic sampling and analyze their results.
Radford University
Summer Woes!
Who can afford the computer required to land a summer job? Pupils work in pairs to solve problems related to finding the number of hours needed to work to purchase a given item. Individuals then work on a performance-based assessment to...
Fort Bend Independent School District
Data Analysis - AP Statistics
What better way to study survey design than to design your own survey! Bring a versatile data analysis project to your AP Statistics class, and encourage them to apply the practices from their instructions to a real-world survey project.
Curated OER
M & M Madness
M&M's are always a great manipulative to use when teaching math. In this graphing lesson plan, learners predict how many of each color of M & M's there are. They count up each color and plug the data into a graph using the...
Curated OER
Practice: Word Problems
Congratulations, you've just hit the word problem jackpot! Covering an incredible range of topics from integers and fractions, to percents, geometry, and much more, this collection of worksheets will keep young mathematicians busy...
Los Angeles County Office of Education
Assessment For The California Mathematics Standards Grade 6
Test your scholars' knowledge of a multitude of concepts with an assessment aligned to the California math standards. Using the exam, class members show what they know about the four operations, positive and negative numbers, statistics...
Noyce Foundation
Ducklings
The class gets their mean and median all in a row with an assessment task that uses a population of ducklings to work with data displays and measures of central tendency. Pupils create a frequency chart and calculate the mean and median....
Curated OER
Mystify with the Mathematics of Ancient Egypt
Hieroglyphics, surveying, and the pyramids may all be explored with mathematics.
McGraw Hill
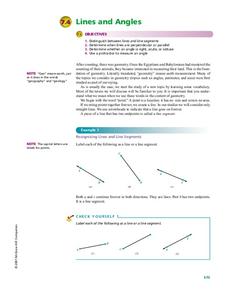
Lines and Angles
Why was the obtuse angle upset? Because it was never right! A valuable resource is loaded with background information on types of angles and lines. Learners review the characteristics of parallel, perpendicular, and intersecting lines,...
Curated OER
Statistical Pictures of School and Life
Students explore how mathematical data is used to summarize and illustrate everyday life. They apply mathematical concepts and skills to analyze data. Students conduct a five question survey of 50 people or more and graph the data.
Curated OER
Taking Poll Information
Students investigate the election and poll surveys. In this statistics lesson, students take poll information and analyze the data. They graph their data and make predictions and conjectures.
Curated OER
M & M Madness
Second graders graph M & M's by color. In this graphing lesson plan, 2nd graders first predict how many of each color they think are in a handful of M & M's. Then they graph the amounts of each color on a computer program....
Curated OER
Making Graphs
Students explore statistics by conducting class demographic surveys. In this graph making activity, students identify the family members of each classmate, pets they own, and favorite activities. Students organize their statistics and...
Curated OER
Data Collection Project
Students collect data using email. They calculate the mean, median, mode, range and outliers. They create a graph using the data results. They write five paragraphs to summarize their data.
Curated OER
A Statistical Study on the Letters of the Alphabet
Students use a book or magazine to research the use of letters. They complete a worksheet and compare their results.
Curated OER
Data Collection and Presentation
Middle and high schoolers collect and analyze data from four different activities. The activities include information about classmates, tallying colors of cars in a parking lot, stem and leaf plots, and making a histogram from winning...
Curated OER
Tax, Tip and Discount Word Problems
Students solve problems involving tax, tips and discounts. In this algebra lesson, students convert between percents and decimals. They calculate commission using conversion from percents and fractions.
Curated OER
Making Math Meaningful in March Madness
Middle schoolers examine the statistics of March Madness, the college basketball tournament. They watch videotaped basketball games to collect data for further analysis using Word and Excel. They analyze the data in a variety of...
Curated OER
The Statistics Sampler
Students define sample, describe a random sample, and discuss what compromises a sample. They determine a sample size to estimate a population characteristic with confidence.
Curated OER
Where Have All the Endangered Gone?
Students explore animals that are endangered. They choose an endangered animal that they would like to keep from becoming extinct. Students create a persuasive presentation to persuade someone to understand why they feel keeping their...


