Willow Tree
Common Geometric Figures
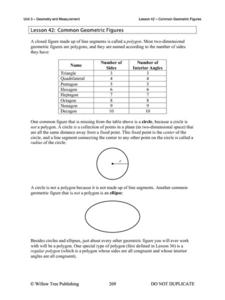
Geometry could be called the study of figures. An overview of the figures found in a typical geometry course contains a study of different triangles, quadrilaterals, and regular polygons.
Willow Tree
Angle Sum Property of Triangles
All triangles have some things in common. Using these properties of triangles, learners find missing angle measures. Scholars use the Angle Sum Property and properties of special triangles throughout the lesson.
Willow Tree
The Fundamental Counting Principle
How many different outfits can you make with what you have in your closet? The Fundamental Counting Principle can help you find an answer! Learners find totals using the Fundamental Counting Principle with problems that can have...
Willow Tree
Simple Probability
The probability of learning from this lesson is high! Learners calculate probabilities as numbers and as decimals. They see how to use a complement to find a probability and even try a simple geometric probability problem.
Willow Tree
Data Sampling
Some say that you can make statistics say whatever you want. It is important for learners to recognize these biases. Pupils learn about sample bias and the different types of samples.
Willow Tree
Box-and-Whisker Plots
Whiskers are not just for cats! Pupils create box-and-whisker plots from given data sets. They analyze the data using the graphs as their guide.
Willow Tree
Extremes, Range, and Quartiles
The middle of the data is important, but what about the rest of it? The lesson shows learners the importance of the range, quartiles, and extreme values. Pupils practice finding each of these values from given data sets.
Willow Tree
Mean, Median, and Mode
Statistics are more than just numbers—they can give you important information about a set of data. Pupils learn how to find the mean, median, and mode of a data set. They also find the next score to reach a desired mean.
Willow Tree
Histograms and Venn Diagrams
There are many different options for graphing data, which can be overwhelming even for experienced mathematcians. This time, the focus is on histograms and Venn diagrams that highlight the frequency of a range of data and overlap of...
Willow Tree
Bar Graphs
Circles, lines, dots, boxes: graphs come in all shapes in sizes. Scholars learn how to make a bar graph using univariate data. They also analyze data using those bar graphs.
Willow Tree
Line Plots
You can't see patterns in a jumble of numbers ... so organize them! Learners take a set of data and use a line plot to organize the numbers. From the line plot, they find minimum, maximum, mean, and make other conclusions about the...
Willow Tree
Line Graphs
Some data just doesn't follow a straight path. Learners use line graphs to represent data that changes over time. They use the graphs to analyze the data and make conclusions.
Willow Tree
Circle Graphs
Pie isn't just for eating! Scholars learn to create pie charts and circle graphs to represent data. Given raw data, learners determine the percent of the whole for each category and then figure out the degree of the circle that percent...
Willow Tree
Approximating a Line of Best Fit
You may be able to see patterns visually, but mathematics quantifies them. Here learners find correlation in scatterplots and write equations to represent that relationship. They fit a line to the data, find two points on the line, and...
Willow Tree
Scatterplots and Stem-and-Leaf Plots
Is there a correlation between the number of cats you own and your age? Use a scatter plot to analyze these correlation questions. Learners plot data and look for positive, negative, or no correlation, then create stem-and-leaf plots to...
Willow Tree
Surface Area of Three-Dimensional Figures
Lateral area and surface area are simple concepts, but calculating them is not as easy! Using formulas, learners calculate lateral area and surface area for the same three-dimensional figures. The resource discusses the formula variables...
Willow Tree
Three-Dimensional Figures
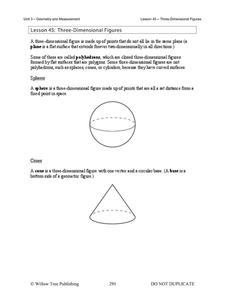
Time to move into the third dimension! Learn the names of the geometric solids and count faces, edges, and vertices. Then learn to recognize nets that create a given solid.
Willow Tree
Area of Common Geometric Figures
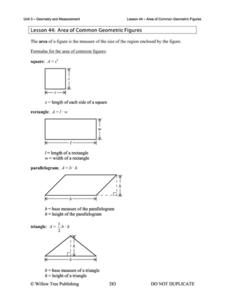
Scholars can use area formulas, but can they apply what they know about area? The activity challenges learners to think logically while practicing finding area of shapes such as rectangles, circles, parallelograms, triangles, and other...
Willow Tree
Perimeter of Common Geometric Figures
Help learners understand that perimeter and circumference are one in the same. Learners apply their skills to determine the perimeter/circumference of triangles, rectangles, and circles. They then use the same strategy to find the...
Willow Tree
Dimensional Analysis
Convey to your pupils the importance of units, then show how to use dimensional analysis to perform a unit conversion. The math lesson includes detailed worked-out solutions to guide learners in their practice.
Willow Tree
Measurement
Build a basic understanding of units of measure and create a great foundation for your learners. The activity gives a complete overview of everything measurement, from types of measurement to rounding to conversions — it has it all!
Willow Tree
Transformations
How does something go from here to there? Describe it with a transformation. Young mathematicians learn how to translate, reflect, rotate, and dilate an image.
Willow Tree
Ratios and Proportions with Congruent and Similar Polygons
Investigate how similar and congruent figures compare. Learners understand congruent figures have congruent sides and angles, but similar figures only have congruent angles — their sides are proportional. After learning the...
Willow Tree
Midpoint and Distance Formulas
The shortest distance between two points is a straight line. Learners use the Pythagorean Theorem to develop a formula to find that distance. They then find the midpoint using an average formula.


