Indiana Department of Education
The Represented World: Communication—Packaging
Challenge your classes to design and market a new product. Collaborative groups use geometry skills to create packaging for their products. Finally, they plan a marketing strategy to present to a marketing specialist.
Towson University
The Crucial Concentration
Which sports drink provides the best pick-me-up after the big game or grueling workout? It may not be the one you'd think! Food science is the focus in a surprising lab activity. Pupils use colorimetry to determine the amount of protein,...
Towson University
It's a Gassy World!
How much does your class know about the relationship between climate change and carbon dioxide? Science scholars explore the nature of greenhouse gases and rising ocean temperature through demonstrations, research, and experiments. The...
CK-12 Foundation
Single Bar Graphs: Hockey Teams
Raise the bar for hockey fans. Using data about favorite hockey teams, pupils build a bar graph. They use the information from the graph to make comparisons and solve one- and two-step problems.
CK-12 Foundation
Types of Data Representation: Baby Due Date Histogram
Histograms are likely to give birth to a variety of conclusions. Given the likelihood a woman is to give birth after a certain number of weeks, pupils create a histogram. The scholars use the histogram to analyze the data and answer...
CK-12 Foundation
Displaying Categorical Variables: Spending Habits
Bar or circle graph—which is best? Given a circle graph and a total amount of money earned, pupils calculate the amount of money in each category. Learners use the calculated amounts to create a bar graph and compare the two displays.
CK-12 Foundation
Data Summary and Presentation: Chart for Grouping Data
Get social! Create a display of social media use for a class. Pupils use provided information about the time spent on social media to construct a histogram. Using the histogram, learners interpret the data to answer questions.
National Council of Teachers of Mathematics
Geogebra: Residuals and Linear Regression
If the line fits, use it. Using a Geogebra interactive, pupils plot points and try to find the best fit line. They assess the linear fit by analyzing residuals. A radio button allows participants to show the regression line and the...
Education Development Center
Finding Parallelogram Vertices
Four is the perfect number—if you're talking about parallelograms. Scholars determine a possible fourth vertex of a parallelogram in the coordinate plane given the coordinates of three vertices. They read a conversation...
Education Development Center
Similar Triangles
Model geometric concepts through a hands-on approach. Learners apply similar triangle relationships to solve for an unknown side length. Before they find the solution, they describe the transformation to help identify corresponding sides.
CK-12 Foundation
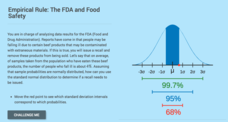
Computing Probabilities for the Standard Normal Distribution: The FDA and Food Safety
To recall or not to recall, that is the question. Using provided data, pupils calculate the percent of people that may fall ill on average. The scholars determine the standard deviation based upon the mean and the empirical rule, then...
Education Development Center
Creating a Polynomial Function to Fit a Table
Discover relationships between linear and nonlinear functions. Initially, a set of data seems linear, but upon further exploration, pupils realize the data can model an infinite number of functions. Scholars use multiple representations...
Education Development Center
Interpreting Statistical Measures—Class Scores
Explore the effect of outliers through an analysis of mean, median, and standard deviation. Your classes examine and compare these measures for two groups. They must make sense of a group that has a higher mean but lower median compared...
Education Development Center
Absolute Value Reasoning
Teach solving absolute value inequalities through inquiry. Groups use their knowledge of absolute value and solving inequalities to find a solution set to an absolute value inequality. Working collaboratively encourages discussion,...
CK-12 Foundation
Expected Value: Playing Darts
The expected payoff is right on target. An interactive resource provides a dart game scenario with amounts of cash prizes and probabilities of winning. Learners calculate the expected value and expected payoff for the game. To finish,...
CK-12 Foundation
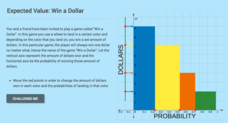
Expected Value: Win a Dollar
Spin a wheel, land on a color ... and win. Learners create a graph to display the probabilities of the amount of money they can win by spinning a colored wheel. The pupils use the dollar amounts and their probabilities to calculate the...
CK-12 Foundation
Expected Value: Game of Chance
Determine whether the payoff is worth it. Pupils calculate the expected value of a game with three different payoff levels. Each level has a different probability of winning money. The scholars find the expected payoffs for each level...
CK-12 Foundation
Expected Value: Creating a Discrete Probability Distribution Table
Wanna roll the dice? Determine whether it is a good idea to play a dice game. An interactive presents the rules for a game of dice. Pupils find the probabilities of each event and calculate the expected value of the game. They finish...
CK-12 Foundation
Sums and Differences of Independent Random Variables: Traveling Seasickness
Use a Punnett square to calculate probabilities. The resource presents a situation in which two patients are randomly selected from a group of patients with a particular illness. Pupils use the interactive to determine the likelihood...
CK-12 Foundation
Dependent Events: Cheryl's Birthday
Use dependency to find a birthday. Learners use an interactive to keep track of excluded potential dates of a birthday using information provided to two people about a third's birthday. Scholars then use the dependency between the dates...
Indiana Department of Education
Amusement of the Future
Take your class on the ride of their lives! Physical science scholars get an in-depth look at potential and kinetic energies in an amusement park-themed unit. Students research, design, and promote their own amusement parks, complete...
Mathematics Vision Project
Transformations and Symmetry
Flip, turn, and slide about the coordinate plane. Pupils define the rigid motions and experiment with them before determining the relationships of the slopes of parallel and perpendicular lines. The sixth unit in a nine-part series...
California Education Partners
T Shirts
Which deal is best? Learners determine which of two companies has the best deal for a particular number of shirts. They begin by creating a table and equations containing each company's pricing structure. Individuals finish the seventh...
California Education Partners
Animals of Rhomaar
Investigate the growth rates of alien animals. Pupils study fictional animals from another planet to determine how much they grow per year. The investigators plot the growth of their animals over a period of time and then compare them to...


