Shodor Education Foundation
Shodor Interactivate: Interactive: Scatter Plot
Use this interactive applet to input a series of (x, y) ordered pairs and plot them. Parameters such as minimum and maximum value, minimum and maximum y value, and x- and y-scale can be set by the user or determined by the applet.
Texas Instruments
Texas Instruments: Scatter Plots
Basic activity of collecting data and graphing sets of data to see if there is a relationship.
Texas Instruments
Texas Instruments: Birthday Scatter Plot
Students will be able to interpret a scatter plot to see if there is a relationship between the two variables.
Texas Instruments
Texas Instruments: Burning Volumes
An analysis of how the volume of various jars impacts the burning time of candles. Data collected will be used to explore modeling, line fitting and linear regression Using graphing calculators.
Texas Instruments
Texas Instruments: Line of Best Fit
In this activity, students learn to collect data and plot the data. They use the manual-fit feature to form a line of best fit.
Texas Instruments
Texas Instruments: Learning to Do Linear Regressions
This activity compares children's age to height to teach linear regressions. The handout includes notes for students and teachers with a step-by-step activity on how to do three types of linear regressions - Best Fit line, Median Line...
Texas Instruments
Texas Instruments: A Wet Welcome Home Adventure 4
Students perform an experiment that simulates a leaking pipe and gather data on volume of water lost over time. They graph the data collected as a scatter plot, find the equation of the line of best fit, find the total volume of water...
California State University
Cal State San Bernardino: Linear Regression
Cal State San Bernardino offers an excellent site on linear regression, including formulas and an applet that allows you to mark the locations of ordered pairs and then determines the equation of the regression line and graphs it.
Ministry of Education and Universities of the Region of Murcia (Spain)
Ministerio De Educacion Y Ciencia: Tablas Y Expresiones Algebraicas
In Spanish. Interactive activities associating data tables with their algebraic graph
Mangahigh
Mangahigh: Data: Scatter Plots
This site provides students practice with the concept of scatter plots. Students can learn about the topic by completing an interactive tutorial. Students can then take a ten question timed test to practice the skill.
National Council of Teachers of Mathematics
Nctm: Illuminations: Linear Regression 1
An interactive program where students will explore regression lines. Students will be introduced to the correlation coefficient and come to understand what it represents through the given exploration. Requires Java.
Khan Academy
Khan Academy: Estimating Slope of Line of Best Fit
Given a scatter plot, can you estimate the slope of the line of best fit that goes through the data points? Students receive immediate feedback and have the opportunity to try questions repeatedly, watch a video, or receive hints.
Other
Sky Mark: Scatter Plots
This page gives a description of scatter plots along with examples. Also provides explanations and statistics to aid student understanding.
Khan Academy
Khan Academy: Interpreting Slope and Y Intercept of Lines of Best Fit
Practice explaining the meaning of slope and y-intercept for lines of best fit on scatter plots. Students receive immediate feedback and have the opportunity to try questions repeatedly, watch a video, or receive hints.
McGraw Hill
Glencoe Mathematics: Online Study Tools: Scatter Plots
This site gives a short interactive quiz which allows students to self-assess their understanding of the concept of scatter plots.
CK-12 Foundation
Ck 12: Algebra: Applications of Function Models
[Free Registration/Login may be required to access all resource tools.] In this lesson students draw a scatter plot of data, find and draw the function that best fits that data, and make predictions from that information. Students watch...
Khan Academy
Khan Academy: Estimating Equations of Lines of Best Fit and Making Predictions
Practice estimating the equation of a line of best fit through data points in a scatter plot. Then use the equation to make a prediction. Students receive immediate feedback and have the opportunity to try questions repeatedly, watch a...
University of Waterloo (Canada)
Univ. Of Waterloo: Wired Math: Linear Graphing: Graphing and Analyzing [Pdf]
The mathematics resource assesses students on linear relations. The activity has problems with graphing and analyzing linear relations. Some of the topics included are variation, scatter plots and linear relationships. The worksheet has...
University of Illinois
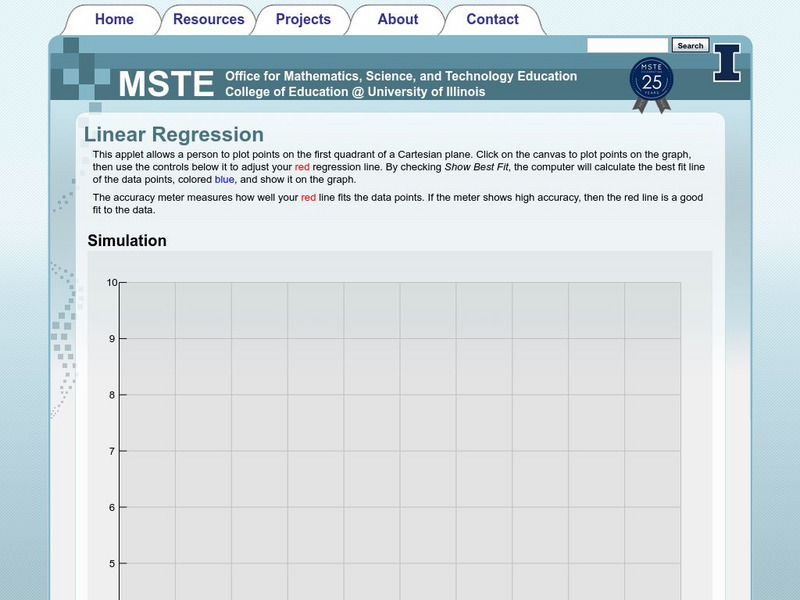
University of Illinois: Linear Regression Applet
This applet allows you to plot up to fifty points and it will display a best fit line and give you the slope of that line.
Khan Academy
Khan Academy: Eyeballing the Line of Best Fit
Students practice informally graphing a line of best fit to a scatter plot and answer questions to determine if a scatter plot has a correlation. Students receive immediate feedback and have the opportunity to watch a video, get hints,...
Khan Academy
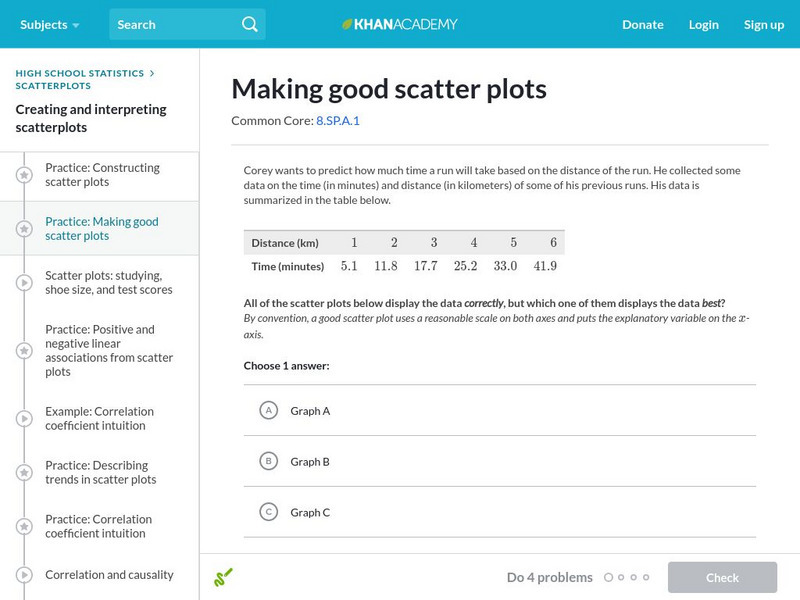
Khan Academy: Making Good Scatter Plots
A good scatter plot has the independent variable on the x-axis and the dependent variable on the y-axis. Also, the scale of both axes should be reasonable, making the data as easy to read as possible. In these practice problems, we...
Khan Academy
Khan Academy: Positive and Negative Linear Associations From Scatter Plots
Practice identifying the types of correlations shown in scatter plots. Sometimes we see linear correlations (positive or negative), sometimes we see non-linear correlations (the data seems to follow a curve), and other times we don't see...
Illustrative Mathematics
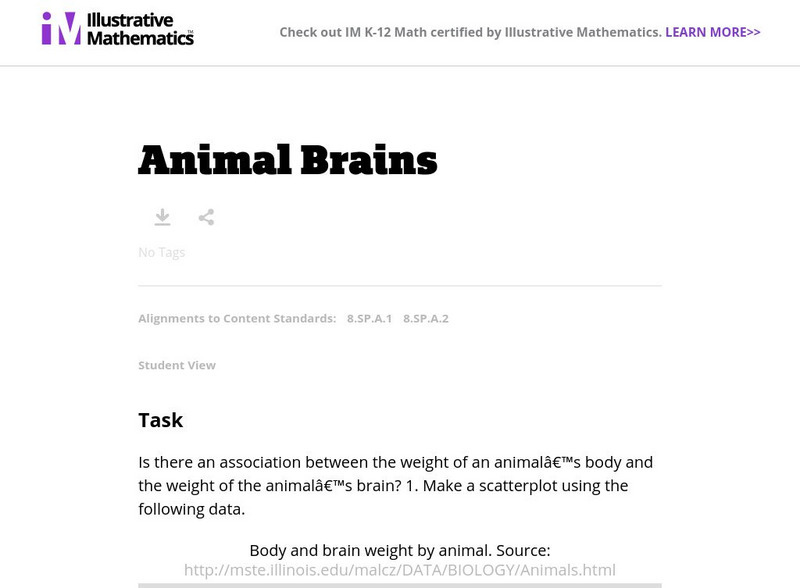
Illustrative Mathematics: 8.sp Animal Brains
This task looks at a possible relationship between the weight of an animal's body and the weight of its brain. Students make a scatter plot of data, look for outliers, make a second scatter plot without the outliers, and describe the...
Illustrative Mathematics
Illustrative Mathematics: 8.sp.1 Hand Span and Height
This task looks at a possible relationship between height and hand size. Students collect data from classmates, make a scatter plot, and explain the relationship as linear or nonlinear. Aligns with 8.SP.A.1.






![Univ. Of Waterloo: Wired Math: Linear Graphing: Graphing and Analyzing [Pdf] Unknown Type Univ. Of Waterloo: Wired Math: Linear Graphing: Graphing and Analyzing [Pdf] Unknown Type](https://d15y2dacu3jp90.cloudfront.net/images/attachment_defaults/resource/large/FPO-knovation.png)
