Illustrative Mathematics
Accuracy of Carbon 14 Dating I
Here is an activity that is intended to highlight a very important issue about precision in reporting and understanding statements in a realistic scientific context. Discuss different ways of reporting the half life of Carbon 14 using...
Curated OER
Application and Modeling of Standard Deviation
The first activity in this resource has learners computing the mean and standard deviation of two different data sets and drawing conclusions based on their results. The second activity has them using a dice-rolling simulation to...
Illustrative Mathematics
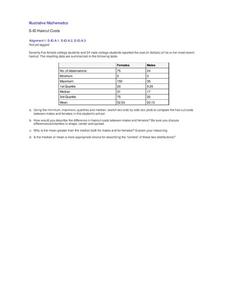
Haircut Costs
Who pays more for haircuts, men or women? Given quartile values, learners construct box and whiskers plots and interpret the results. They compare the mean and median, and discuss which is more appropriate under particular conditions....
Illustrative Mathematics
Speed Trap
In which direction is traffic moving faster, north or south? Use box and whisker plots to organize data and interpret the results. Detailed solutions are included. This activity would be good as a warm up or quick assessment at the end...
Alabama Learning Exchange
I Know What You Did Last Summer: A Data Graphing Project
Young scholars participate in graphing data. In this graphing data lesson, students make a stem and leaf plot of their summer activities. Young scholars create numerous graphs on poster boards. Students discuss the differences between...
University of South Florida
Fcat: Drops on a Penny: Teacher Notes
Students learn how to create stem-and-leaf diagrams and boxplots by collecting data on the surface tension of water molecules. This hands-on activity using pennies is a great way to learn how to organize data.
Texas Education Agency
Texas Gateway: Interpreting Scatterplots
Given scatterplots that represent problem situations, the student will determine if the data has strong vs weak correlation as well as positive, negative, or no correlation.
Varsity Tutors
Varsity Tutors: Hotmath: Practice Problems: Correlation and Lines of Best Fit
Twenty problems present a variety of practice determining correlation based on data in a scatter plot and using lines of best fit with given data. They are given with each step to the solution cleverly revealed one at a time. You can...
Math Is Fun
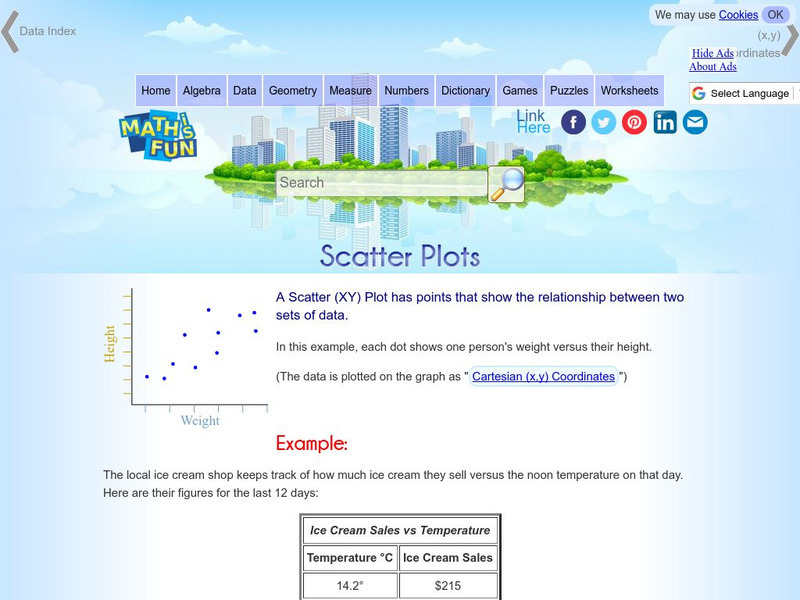
Math Is Fun: Scatter Plots
Explains, with examples, what scatter plots are and how to interpret the data. Discusses trends, interpolation and extrapolation, and correlation. Includes a set of practice questions.
National Institute of Standards and Technology (NIST)
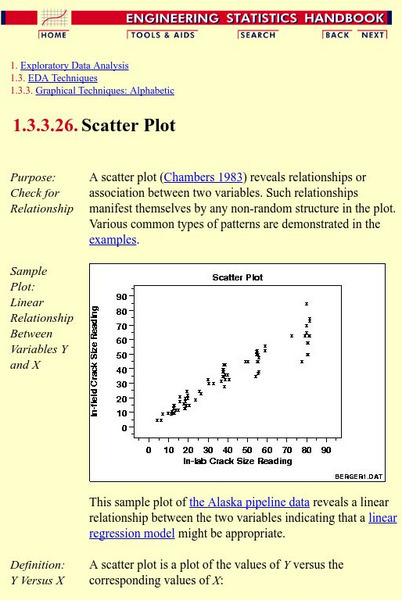
Nist: Engineering Statistics Handbook: Scatter Plots and Linear Regression
An explanation of scatter plots followed by examples of the many different kinds of scatter plots.
Science Education Resource Center at Carleton College
Serc: The Evolution of Pearson's Correlation Coefficient
For this activity, students explore nine scatter plots to develop their understanding of how two quantitative variables are related. Through an exploration of the properties of this association, they come to understand the standard...
University of Colorado
University of Colorado: Ph Et Interactive Simulations: Least Squares Regression
Create your own scatter plot or use real-world data and try to fit a line to it. Explore how individual data points affect the correlation coefficient and best-fit line.
Other
American Statistical Association: Using Dice to Introduce Sampling Distributions
In this lesson, students use a dice simulation to investigate how random sampling affects the properties of the distribution of a sample proportion, and are introduced to the sampling distribution of the sample proportion.
Other
Online Statistics Education: Graphing Distributions [Pdf]
This is the second chapter of a statistics e-text developed collaboratively by Rice University, University of Houston Clear Lake, and Tufts University. It looks at many different types of data displays and the advantages and...
Oswego City School District
Regents Exam Prep Center: Displaying Data
Use this lesson, practice exercise, and teacher resource in planning instruction on displaying data. In the lessons, you'll find definitions and examples of ways to collect and organize data, quartiles, and box-and-whisker plots, as well...
Oswego City School District
Regents Exam Prep Center: Scatter Plots and Line of Best Fit
Use this lesson, practice exercise, and teacher resource in planning instruction on scatter plots and line of best fit. In the lessons, you'll find definitions and examples of ways to make a scatter plot, determine correlations, and find...
Thinkport Education
Thinkport: Algebra Ii: Standard Deviation
Begin by reviewing mean absolute deviation as a measure of variability. Your new learning will begin with standard deviation and understanding the difference between mean absolute deviation and standard deviation.
Math Drills
Math Drills: Statistics and Probability Worksheets
Download these free worksheets to sharpen your skills with statistics and probability. Sheets focus on collecting and organizing data, measures of central tendency (mean, median, mode, and range), and probability.
Cuemath
Cuemath: Scatter Plot
A comprehensive guide for learning all about scatter plots with definitions, how to construct and solve them, types of scatter plots, solved examples, and practice questions.
Cuemath
Cuemath: Outlier
A comprehensive guide for exploring the topic of outliers with definitions, what is an outlier, how to find outliers using the turkey method and the interquartile range, solved examples, and interactive questions.
Houghton Mifflin Harcourt
Holt, Rinehart and Winston: Homework Help Independent Practice: Scatter Plots
Get independent practice working with scatter plots. Each incorrect response gets a text box explanation and another try. Correct responses are confirmed.
University of Regina (Canada)
University of Regina: Math Central: Scatter Plots
Three different concepts are examined about scatter plots. Topics featured are collecting data, analyzing scatter plots, and determining a line of "best fit". The lesson plan has an overview, material, procedures, and evaluation techniques.
University of Regina (Canada)
University of Regina: Math Central: Scatter Plots
Three different concepts are examined about scatter plots. Topics featured are collecting data, analyzing scatter plots, and determining a line of "best fit". The lesson has an overview, material, procedures, and evaluation techniques.


