Curated OER
Application and Modeling of Standard Deviation
The first activity in this resource has learners computing the mean and standard deviation of two different data sets and drawing conclusions based on their results. The second activity has them using a dice-rolling simulation to...
Curated OER
Golf and Divorce
There seems to be an interesting relationship between the increasing numbers of golf courses and divorce. Assess student understanding of correlation and causation by asking them to explain what it is. Use this short activity as a class...
Curated OER
Coffee and Crime
Is there a correlation between the number of coffee shops and the amount of crime in a given area? In this quick exercise, your class will examine the data, interpret the results, and discuss their conclusion. Concepts covered include...
Duke University
Duke University: Web Feats Ii: Lessons on Regression at Hessian
This site has several lessons on regression, "Designed to help students visualize topics associated with lines of regression, given a set of data points." Go to the teacher notes to find the objectives and standards which apply.
University of Hawai'i
University of Hawaii: Understanding Correlation
This page gives a lot of information on correlation, including a section on the coefficient of correlation.
Other
Stat Soft: Multiple Regression
This resource has a lot of information on multiple regression. It also contains information on the regression line.
Google
Google for Education: Correlation vs Causation
In this lesson, students will test the strength of a correlation and discern whether or not a law or conclusion can be made based on that correlation. Students will see the threshold commonly accepted for correlating data and test their...
Texas Education Agency
Texas Gateway: Interpreting Scatterplots
Given scatterplots that represent problem situations, the student will determine if the data has strong vs weak correlation as well as positive, negative, or no correlation.
Varsity Tutors
Varsity Tutors: Hotmath: Practice Problems: Correlation and Lines of Best Fit
Twenty problems present a variety of practice determining correlation based on data in a scatter plot and using lines of best fit with given data. They are given with each step to the solution cleverly revealed one at a time. You can...
Math Is Fun
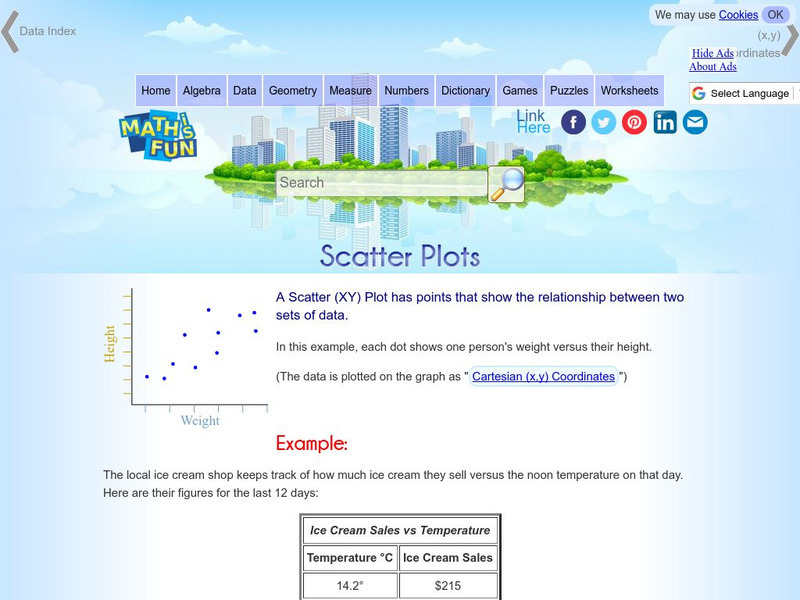
Math Is Fun: Scatter Plots
Explains, with examples, what scatter plots are and how to interpret the data. Discusses trends, interpolation and extrapolation, and correlation. Includes a set of practice questions.
Annenberg Foundation
Annenberg Learner: Against All Odds: Inside Statistics: Correlation
Twin studies track how similar identical and fraternal twins are on various characteristics, even if they don't grow up together. Correlation lets researchers put a number on it. Scroll down the page to find comprehensive student and...
National Institute of Standards and Technology (NIST)
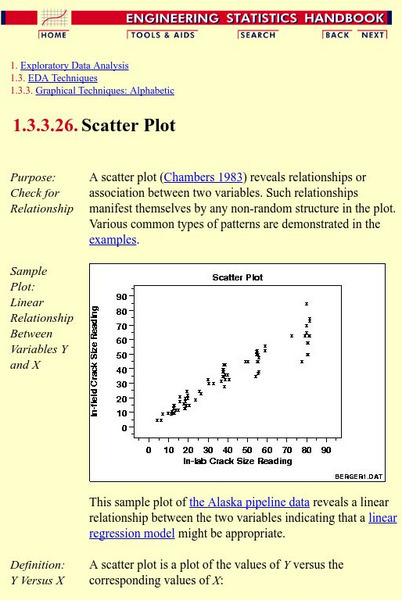
Nist: Engineering Statistics Handbook: Scatter Plots and Linear Regression
An explanation of scatter plots followed by examples of the many different kinds of scatter plots.
Science Education Resource Center at Carleton College
Serc: The Evolution of Pearson's Correlation Coefficient
For this activity, students explore nine scatter plots to develop their understanding of how two quantitative variables are related. Through an exploration of the properties of this association, they come to understand the standard...
Texas Education Agency
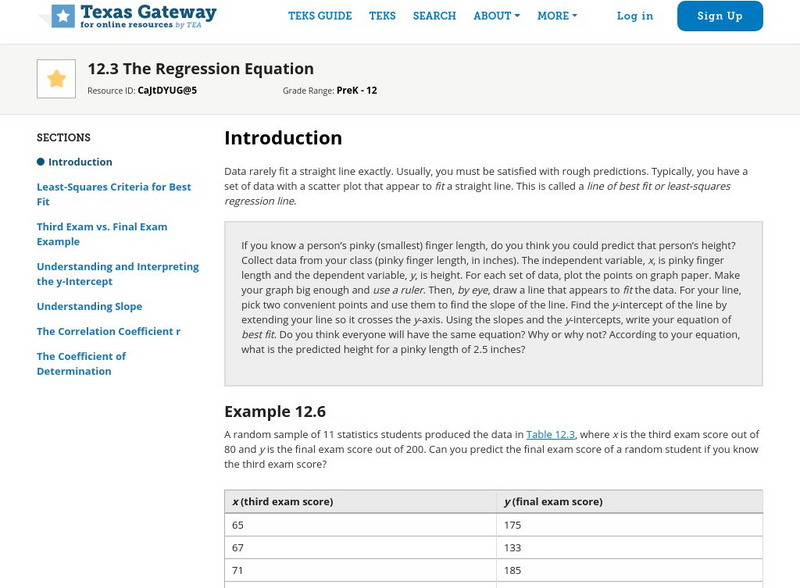
Texas Gateway: Tea Statistics: The Regression Equation
A tutorial on how to find the line of best fit or least-squares regression line for a set of data in a scatter plot using different methods and calculations.
Texas Education Agency
Texas Gateway: Collecting Data and Making Predictions
Given an experimental situation, the student will write linear functions that provide a reasonable fit to data to estimate the solutions and make predictions.
Cuemath
Cuemath: Scatter Plot
A comprehensive guide for learning all about scatter plots with definitions, how to construct and solve them, types of scatter plots, solved examples, and practice questions.
Houghton Mifflin Harcourt
Holt, Rinehart and Winston: Homework Help Independent Practice: Scatter Plots
Get independent practice working with scatter plots. Each incorrect response gets a text box explanation and another try. Correct responses are confirmed.
Duke University
Duke University: Introduction to Linear Regression
This page discusses linear regression, its equations, background, and applications. Provides questions, answers, formulas, and explanations for understanding.
University of Illinois
University of Illinois: Scatter Plots and Correlations
This site gives information on scatter plots, along with examples showing high positive correlation, low negative correlation, high negative correlation, no correlation, and low positive correlation.
National Council of Teachers of Mathematics
The Math Forum: Ask Dr. Math: Regression Method
This page goes over what regression method is and how a regression line fits in. Dr. MAth also suggests a book on regression if you are interested.
Texas Instruments
Texas Instruments: Investigate Outliers Effect on Regression Lines
In this activity, students begin to investigate linear regression by looking at the effect of outliers on the regression line. The worksheet is interactive.
Texas Instruments
Texas Instruments: Work vs. Leisure
Students can use lists of data and the correlation factor of various regressions to determine the best regression line.
Texas Instruments
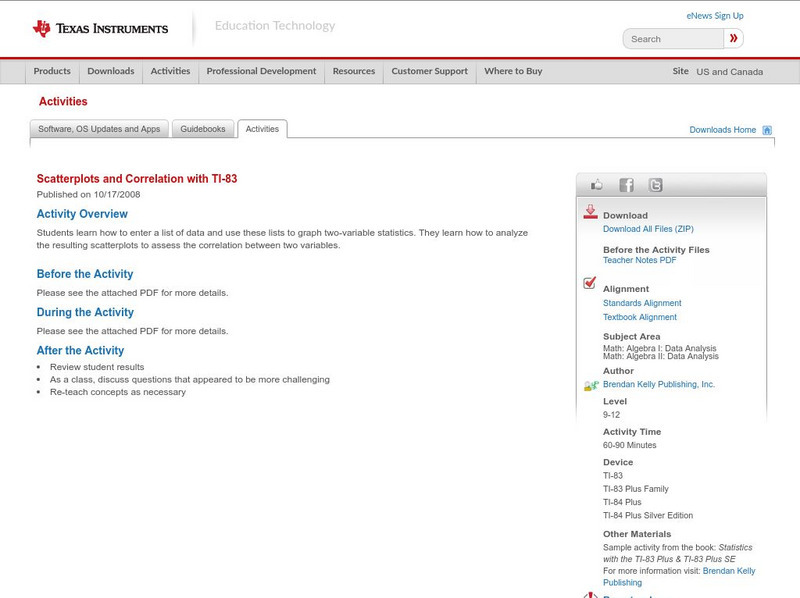
Texas Instruments: Scatterplots and Correlation With Ti 83
Students learn how to enter a list of data and use these lists to graph two-variable statistics. They learn how to analyze the resulting scatterplots to assess the correlation between two variables.
Texas Instruments
Texas Instruments: Height vs Arm Span
This is a quick class opener. That allow students to practice reading scatter plots and determining the correlation among data points.


