Corbett Maths
The Range
Spread the data out on the range. The short video provides a definition of the range. Using a data set of five numbers, the resource calculates the range.
Corbett Maths
The Mode
Most frequently prefer the mode. The resource defines the mode and shows how to determine it in a data set. Using another type of problem, the video develops a data set with a given mode and number of data points.
Concord Consortium
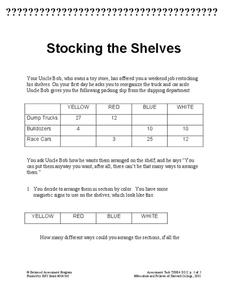
Stocking the Shelves
How many ways can you stock a shelf? It's probably more than you think! Young scholars use data in a frequency table to determine how many ways to stock a shelf given a specific constraint for types of groups. They then repeat the task...
Facebook
Cybersecurity, Phishing, and Spam
Take a serious look at an equally serious topic! Security scholars explore and discuss the methods hackers use to gain access to personal information during a well-written digital citizenship activity. Part of an extensive series, the...
American Statistical Association
More Confidence in Salaries in Petroleum Engineering
Making inferences isn't an exact science. Using data about salaries, learners investigate the accuracy of their inferences. Their analyses includes simulations and randomization tests as well as population means.
American Statistical Association
Chunk it!
Chunking information helps you remember that information longer. A hands-on activity tests this theory by having learners collect and analyze their own data. Following their conclusions, they conduct randomization simulations to test...
Statistics Education Web
Which Hand Rules?
Reaction rates vary between your dominant and nondominant hand ... or do they? Young scholars conduct an experiment collecting data to answer just that. After collecting data, they calculate the p-value to determine if the difference is...
Mascil Project
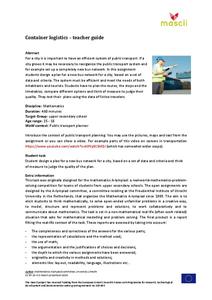
Amberhavn: New Bus Network
Public transportation is an important aspect of any growing city. Collaborative groups work to redesign a system for a city in need of restructuring. Young scholars design a route, create a timetable, and incorporate a quality control...
University of North Carolina
Sociology
What exactly does sociology entail? Sociology is a broad field that covers many topics, including culture, mass media, and social movements. A helpful handout prepares scholars for typical writing found in college-level sociology...
101 Questions
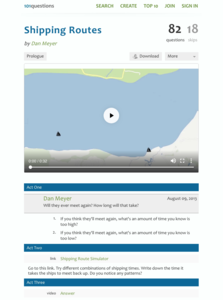
Shipping Routes
The product of the hard work is learning. Scholars use a simulation tool to collect information to analyze. They must decide when two ships traveling back and forth across a river at different rates will meet on the same side. The intent...
Howard Hughes Medical Institute
Human Impacts on Biodiversity
Have you always wanted to take your science class on an amazing field trip they will never forget? Now you can! Observe the wildlife in an African savanna through trail cameras with a five-part data analysis activity. Learners analyze...
Howard Hughes Medical Institute
Spreadsheet Tutorial 2: Autofill Data, Cell References, and Standard Deviation
If you've always wanted to know more about spreadsheets, here's a perfect resource for you. A self-paced tutorial introduces how to autofill and copy formulas in a Google sheet or Excel spreadsheet. It also shows users how to find range,...
Illustrative Mathematics
Growing Bean Plants (Grade 2)
After planting a bean seed in a jar, young scientists observe the growth patterns over several days. As the bean becomes a sprout, and the sprout becomes a plant, partners measure and plot the data. They notice patterns, practice...
Shodor Education Foundation
Linear Inequalities
An interactive lesson helps individuals learn to graph inequalities in two variables. Scholars can adjust the interactive to present the inequalities in standard or slope-intercept form.
CK-12 Foundation
Mode: Kittens
It is not as difficult as herding cats. The short interactive provides a group of kittens to sort according to their colors. Pupils determine the mode of the number of kittens by color. The questions continue with other numbers of...
CK-12 Foundation
Mode: Boxes of Oranges
See how your data stacks up. Pupils stack crates of oranges in increasing order, creating a simple bar graph. Using the graph, individuals determine measures of center and describe the shape of the distribution. Scholars determine what...
CK-12 Foundation
Frequency Tables to Organize and Display Data: Favorite Films
What information can your class determine if they know the number of people attending movie showings? Using the information about the number of people at each screening, learners develop a frequency table. The pupils analyze the type of...
CK-12 Foundation
Understand and Create Histograms: Histograms
Tally ho! Represent the frequency of ages at school. Pupils finish a tally chart to match the frequencies of ages at school. Using the frequencies, the learners create a histogram. With the aid of the histogram and the frequency table,...
CK-12 Foundation
Understand and Create Histograms: Car Sales
Create a history of car sales. Pupils create a histogram/bar graph to show the number of car sales made during the week. Using the data display, learners calculate numerical summaries of the data and find the percent of cars sold during...
CK-12 Foundation
Multiple Bar Graphs
I scream, you scream, we all scream for ice cream bar graphs. Pupils create a multiple bar chart to represent the sales of ice cream products during the first week of summer. Using the chart, learners find the day that each of the...
CK-12 Foundation
Double Bar Graphs: Favorite Cookies Chart
It's just the way the cookie crumbles. Using the data from a class poll, learners create a double bar graph showing favorite cookie types. The pupils compare favorites between boys and girls with the aid of their graphs, then they make...
CK-12 Foundation
Single Bar Graphs: Hockey Teams
Raise the bar for hockey fans. Using data about favorite hockey teams, pupils build a bar graph. They use the information from the graph to make comparisons and solve one- and two-step problems.
CK-12 Foundation
Types of Data Representation: Baby Due Date Histogram
Histograms are likely to give birth to a variety of conclusions. Given the likelihood a woman is to give birth after a certain number of weeks, pupils create a histogram. The scholars use the histogram to analyze the data and answer...
CK-12 Foundation
Data Summary and Presentation: Chart for Grouping Data
Get social! Create a display of social media use for a class. Pupils use provided information about the time spent on social media to construct a histogram. Using the histogram, learners interpret the data to answer questions.


