Charleston School District
Contextualizing Function Qualities
Let the graph tell the story! Adding context to graphs allows learners to analyze the key features of the function. They make conclusions about the situation based on the areas the graph is increasing, decreasing, or has a maximum or...
Charleston School District
Solving Systems with Elimination
Can you handle one more method? It just might be your favorite! Building on the skills learned in the previous lessons in the series, scholars now learn the elimination method. The video examines problems of varying difficulty.
Charleston School District
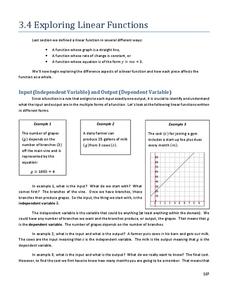
Exploring Linear Functions
What does a graph or equation say about a situation? Lots! The lesson uses the concepts explored in the previous four lessons in the series and applies them to problem solving situations. Learners create an equation from problems posed...
EngageNY
Applying Tangents
What does geometry have to do with depression? It's an angle of course! Learners apply the tangent ratio to problem solving questions by finding missing lengths. Problems include angles of elevation and angles of depression. Pupils make...
EngageNY
Mid-Module Assessment Task - Geometry (Module 2)
Challenge: create an assessment that features higher level thinking from beginning to end. A ready-made test assesses knowledge of dilations using performance tasks. Every question requires a developed written response.
EngageNY
How Far Away Is the Moon?
Does the space shuttle have an odometer? Maybe, but all that is needed to determine the distance to the moon is a little geometry! The lesson asks scholars to sketch the relationship of the Earth and moon using shadows of an eclipse....
EngageNY
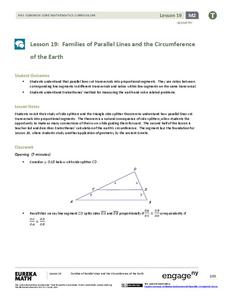
Families of Parallel Lines and the Circumference of the Earth
How do you fit a tape measure around the Earth? No need if you know a little geometry! Pupils begin by extending their understanding of the Side Splitter Theorem to a transversal cut by parallel lines. Once they identify the proportional...
EngageNY
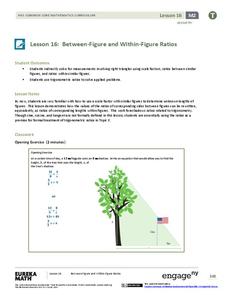
Between-Figure and Within-Figure Ratios
Tie the unit together and see concepts click in your young mathematicians' minds. Scholars apply the properties of similar triangles to find heights of objects. They concentrate on the proportions built with known measures and solve to...
Los Angeles County Office of Education
Assessment for the California Mathematics Standards Grade 2
Test scholars mathematic skills with an assessment addressing addition, subtraction, multiplication, place value, measurement, geometric shapes, expanded notation; and their ability to compare numbers, write number sentences, draw...
EngageNY
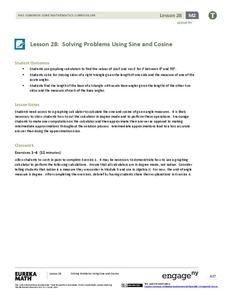
Solving Problems Using Sine and Cosine
Concepts are only valuable if they are applicable. An informative resource uses concepts developed in lessons 26 and 27 in a 36-part series. Scholars write equations and solve for missing side lengths for given right triangles. When...
EngageNY
Graphs of Quadratic Functions
How high is too high for a belly flop? Learners analyze data to model the world record belly flop using a quadratic equation. They create a graph and analyze the key features and apply them to the context of the video.
Curated OER
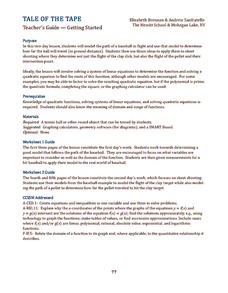
Tale of the Tape
How can baseball and skeet-shooting be modeled mathematically? Sports lovers and young mathematicians learn how to use quadratic equations and systems of equations to model the flight paths of various objects.
EngageNY
Graphing Quadratic Functions from Factored Form
How do you graph a quadratic function efficiently? Explore graphing quadratic functions by writing in intercept form with a lesson that makes a strong connection to the symmetry of the graph and its key features before individuals write...
EngageNY
Modeling with Quadratic Functions (part 2)
How many points are needed to define a unique parabola? Individuals work with data to answer this question. Ultimately, they determine the quadratic model when given three points. The concept is applied to data from a dropped object,...
EngageNY
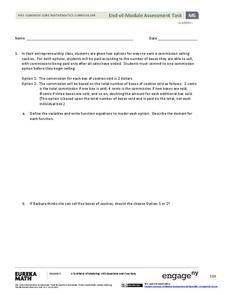
End-of-Module Assessment Task - Algebra 1 (Module 5)
This unit assessment covers the modeling process with linear, quadratic, exponential, and absolute value functions. The modeling is represented as verbal descriptions, tables, graphs, and algebraic expressions.
EngageNY
Modeling a Context from a Verbal Description (part 2)
I got a different answer, are they both correct? While working through modeling problems interpreting graphs, the question of precision is brought into the discussion. Problems are presented in which a precise answer is needed and others...
EngageNY
Modeling a Context from a Verbal Description (part 1)
When complicated algebraic expressions are involved, it is sometimes easier to use a table or graph to model a context. The exercises in this lesson are designed for business applications and require complex algebraic expressions.
EngageNY
Modeling a Context from Data (part 2)
Forgive me, I regress. Building upon previous modeling activities, the class examines models using the regression function on a graphing calculator. They use the modeling process to interpret the context and to make predictions based...
EngageNY
Modeling from a Sequence
Building upon previous knowledge of sequences, collaborative pairs analyze sequences to determine the type and to make predictions of future terms. The exercises build through arithmetic and geometric sequences before introducing...
EngageNY
Analyzing a Data Set
Through discussions and journaling, classmates determine methods to associate types of functions with data presented in a table. Small groups then work with examples and exercises to refine their methods and find functions that work to...
EngageNY
End-of-Module Assessment Task - Algebra 1 (Module 4)
Critical thinking is an important aspect of mathematics — it's time to put your brain to work! Use this assessment to challenge pupils and test their skills. Concepts assessed include function notation, factoring, completing the square,...
EngageNY
Modeling with Quadratic Functions (part 1)
Relevance is key! The resource applies quadratic modeling by incorporating application of physics and business. Pupils work through scenarios of projectile motion and revenue/profit relationships. By using the key features of the graph,...
EngageNY
Comparing Quadratic, Square Root, and Cube Root Functions Represented in Different Ways
Need a real scenario to compare functions? This lesson has it all! Through application, individuals model using different types of functions. They analyze each in terms of the context using the key features of the graphs.
EngageNY
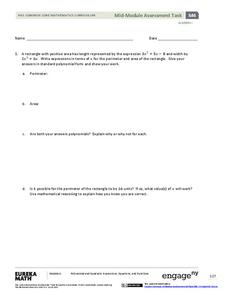
Mid-Module Assessment Task - Algebra 1 (module 4)
Performance task questions are the most difficult to write. Use this assessment so you don't have to! These questions assess factoring quadratics, modeling with quadratics, and key features of quadratic graphs. All questions require...


