EngageNY
End-of-Module Assessment Task: Grade 8 Module 6
Test your knowledge of linear functions and models. The last installment of a 16-part module is an end-of-module assessment task. Pupils solve multi-part problems on bivariate data based on real-world situations to review concepts from...
EngageNY
Nonlinear Models in a Data Context
How well does your garden grow? Model the growth of dahlias with nonlinear functions. In the lesson, scholars build on their understanding of mathematical models with nonlinear models. They look at dahlias growing in compost and...
EngageNY
Using Linear Models in a Data Context
Practice using linear models to answer a question of interest. The 12th installment of a 16-part module combines many of the skills from previous lessons. It has scholars draw scatter plots and trend lines, develop linear models, and...
EngageNY
Linear Models
Expand your pupils' vocabulary! Learn how to use statistical vocabulary regarding linear models. The lesson teaches scholars the appropriate terminology for bivariate data analysis. To complete the module, individuals use linear...
EngageNY
Increasing and Decreasing Functions 2
Explore linear and nonlinear models to help your class build their function skills. In a continuation of the previous lesson, learners continue to analyze and sketch functions that model real-world situations. They progress from linear...
EngageNY
Modeling Linear Relationships
Math modeling is made easy with the first installment of a 16-part module that teaches pupils to model real-world situations as linear relationships. They create graphs, tables of values, and equations given verbal descriptions.
Balanced Assessment
Number Game
It's all in the numbers! Create a mathematical model to analyze a number game and develop a winning strategy. Using a given numerical pattern, scholars write an expression to model the scenario. They then interpret the pattern of the...
Balanced Assessment
Toilet Graph
Mathematics can model just about anything—so why not simulate the height of water in a toilet bowl? The lesson asks pupils to create a graphical model to describe the relationship of the height of the water as it empties and fills again....
Balanced Assessment
Dollar Line
Challenge the class to develop a story that matches a graph. The short assessment provides a line graph with the vertical axis labeled as dollars. The task asks pupils to develop a description of a situation that could be represented by...
EngageNY
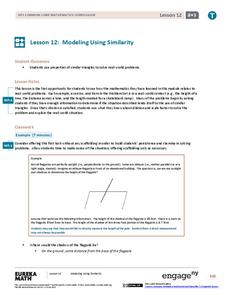
Modeling Using Similarity
How do you find the lengths of items that cannot be directly measured? The 13th installment in a series of 16 has pupils use the similarity content learned in an earlier resource to solve real-world problems. Class members determine...
Balanced Assessment
Bathtub Graph
Represent the relationship between independent and dependent variables through a modeling situation. The activity expects learners to graph the volume of water in a bathtub during a given scenario. The graph should result in two areas of...
Balanced Assessment
Ostrich and Seahorse
Examine the relationship between ratios and scale. Young math scholars compare ratios of two models. They use the ratios to make a comparison between the two models. Each image uses a different scale, which requires learners to think...
Balanced Assessment
Catenary
Develop a model for a hanging chain. Pupils find a mathematical model for a hanging chain and then they compare their models to the precise function that models the curve. Scholars come up with a strategy to determine how close their...
Bowland
Speed Cameras
Do speed cameras help reduce accidents? Scholars investigate this question using a series of spreadsheet activities. Along the way, they learn about randomness, probability, and statistical analysis.
Bowland
Fares Not Fair
What would be a fair fare for a taxi? to answer the questions requires young mathematicians to analyze data on fuel prices and taxi cab fares. They determine and justify a fair fare price.
Bowland
Crash Test
Use mathematics and simulations to investigate car crashes. IScholars test hypotheses involving car crashes. They collect, analyze, and display data from computer simulations to support or refute their hypotheses.
Balanced Assessment
Time Line
Use a graph to tell a story! Given a graph, young scientists create a story to match. They must provide their own axes labels and description of the scenario. The graph has increasing, decreasing, and constant sections.
PreKinders
Christmas Tree Pattern Block Mat
Put the tree back in geometry! Explore shapes and celebrate Christmas while using pentagon, square, and triangle pattern blocks to create a Christmas tree.
Bowland
Youth Hostel
Given a set of criteria, individuals determine how to arrange males and females in a dormitory. They must meet the requirements and communicate their plan clearly.
Balanced Assessment
Fermi Number
A fermi number is a rough estimate of a quantity that is difficult or impossible to measure. Individuals design a process for making an estimation of a given scenario. For example, they determine a plan for estimating the number of...
Balanced Assessment
Monitor Pricing
Out with the old and in with the new. Learners use a set of prices of computer monitors from 1994 to make a prediction. They then use one current price and what they know about the old prices to make a more recent prediction. Their...
EngageNY
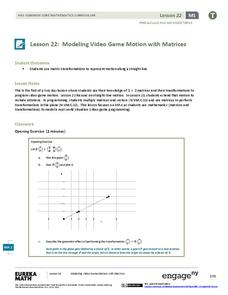
Modeling Video Game Motion with Matrices 1
Video game characters move straight with matrices. The first day of a two-day lesson introduces the class to linear transformations that produce straight line motion. The 23rd part in a 32-part series has pupils determine the...
West Contra Costa Unified School District
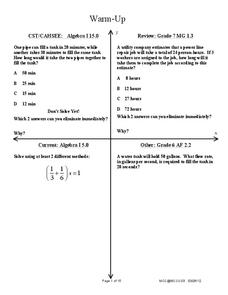
Work Problems – Bar Models
Why do we have to do so much work? Scholars learn how to set up bar models to represent a situation involving work. They use these bar models to help set up equations with rational coefficients to solve the problem situation.
EngageNY
End-of-Module Assessment Task - Algebra 2 (Module 3)
The last installment of a 35-part series is an assessment task that covers the entire module. It is a summative assessment, giving information on how well pupils understand the concepts in the module.


