Curated OER
The Graduation Dilemma
Ninth graders explore data analysis. In this Algebra I lesson, 9th graders collect and organize data to create a scatter plot. Students use the regression feature of the calculator to find the line of best fit and use the equation to...
Curated OER
Unit 13: Graphs, Correlation, Line of Best Fit
Students explore the concepts of graphs, correlations, line of best fit, and the dipstick problem. In this graph, correlation, line of best fit and dipstick problem lesson, students solve problems on the above mentioned topics. ...
Curated OER
Commercial Salmon Fishing
High schoolers work with data about commercial fishing ofsalmon in Alaska. Students gather data, graph it, and analyze it.
Curated OER
Line Of Best Fit: Feet & Forearms
Learners actively find the line of best fit. They gather their own data and then use a calculator to find the line of best fit, as well as the equation. They see how to use the TI 81 calculator in order to find the line of best fit.
Curated OER
Bungee M&M's
Eighth graders experiment with M&M's and a cup attached to a spring to to simulate a bungee jump. They graph the results of the experiment and make predictions for continuing the experiment. They determine the "line of best fit."
Curated OER
Drops on a Penny
Eighth graders experiment to determine the number of drops of water a heads up penny hold. They create a stem and leaf graph of the class results and use the data for further experimentation on a tails up penny.
University of South Florida
Fcat: Bungee M&m's: Teacher Notes
Students will learn how to draw a line of best fit for a set of data using m&m's and a "Bungee."
University of South Florida
Fcat: Shaq's Hand/foot Span: Teacher Notes
Students compare their own hand/foot span to Shaquille O'Neal's, then graph the data & construct a best-fit line. They can then use the information to investigate the proportionality of the human body.
University of South Florida
Fcat: View Tubes: Teacher Notes
In this online activity use view tubes to collect data and determine the linear relationship and line of best fit.
University of South Florida
Florida Center for Instructional Tech: Walking the Plank
Young scholars use weight to collect data and investigate the linear relationship. This activity uses a graphing calculator.
Texas Education Agency
Texas Gateway: Modeling Data With Linear Functions
Given a scatterplot where a linear function is the best fit, the student will interpret the slope and intercepts, determine an equation using two data points, identify the conditions under which the function is valid, and use the linear...
Varsity Tutors
Varsity Tutors: Hotmath: Practice Problems: Correlation and Lines of Best Fit
Twenty problems present a variety of practice determining correlation based on data in a scatter plot and using lines of best fit with given data. They are given with each step to the solution cleverly revealed one at a time. You can...
Math Is Fun
Math Is Fun: Scatter Plots
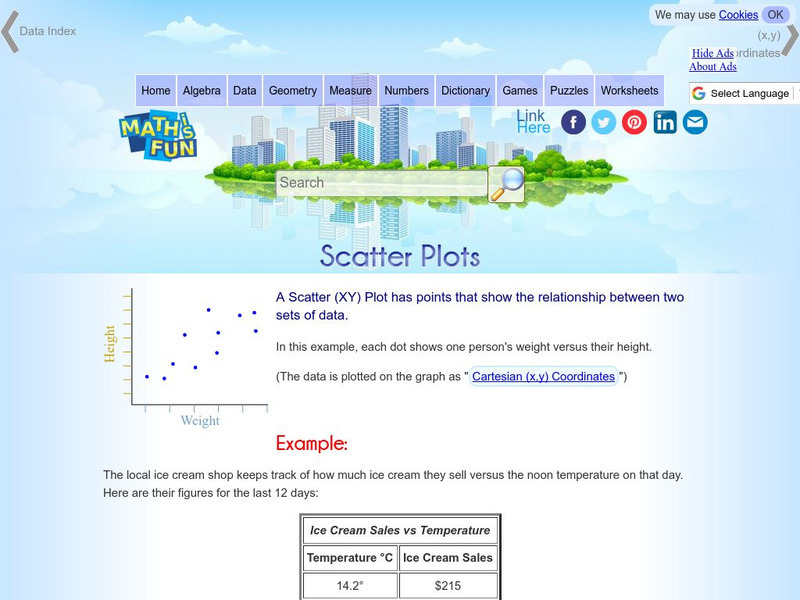
Explains, with examples, what scatter plots are and how to interpret the data. Discusses trends, interpolation and extrapolation, and correlation. Includes a set of practice questions.
University of Colorado
University of Colorado: Ph Et Interactive Simulations: Least Squares Regression
Create your own scatter plot or use real-world data and try to fit a line to it. Explore how individual data points affect the correlation coefficient and best-fit line.
Oswego City School District
Regents Exam Prep Center: Regression Analysis
A collection of lesson ideas, a practice activity, and teacher resources for exploring regression analysis.
Oswego City School District
Regents Exam Prep Center: Scatter Plots and Line of Best Fit
Use this lesson, practice exercise, and teacher resource in planning instruction on scatter plots and line of best fit. In the lessons, you'll find definitions and examples of ways to make a scatter plot, determine correlations, and find...
Texas Education Agency
Texas Gateway: Tea Statistics: The Regression Equation
A tutorial on how to find the line of best fit or least-squares regression line for a set of data in a scatter plot using different methods and calculations.
Texas Education Agency
Texas Gateway: Collecting Data and Making Predictions
Given an experimental situation, the student will write linear functions that provide a reasonable fit to data to estimate the solutions and make predictions.
Other
Honolulu Community College: Galileo's Kinematics
In this experiment you will attempt to reproduce Galileo's results using the inclined plane. You will test three hypotheses relating to motion on an incline. You will learn to draw a "best fit" or regression line of experimental data....
Scholastic
Scholastic: Cultivating Data
Students will understand key concepts of data analysis and their graphic representations. Students will construct and interpret data tables, line plots, box-and-whisker plots and stem-and-leaf plots, scatterplots with line of best fit,...
Texas Instruments
Texas Instruments: A Sweet Drink Adventure 7
Students determine how the temperature of water affects the dissolving time of a sugar cube. They create, interpret and analyze graphs of data, find an equation of the line of best fit, and relate slope to rate of change.
Texas Instruments
Texas Instruments: Use the Regression Feature to Find a Line of Best Fit
This tutorial shows you how to enter a set of data and find the line of best fit.
Texas Instruments
Texas Instruments: The Phone Bill Problem
The student is given actual data and asked to find a line of best fit and to give "real world" interpretations of the slope and y-intercept. A great introduction to the 83/84 and its features.
Texas Instruments
Texas Instruments: What Is Linear Regression?
In this activity, students will explore finding the line of best fit based on the sum of the squares of the residuals and determine what the linear regression line is.


